
VisualCave
varkart/visualcave
Diagramas técnicos interativos em HTML com Mermaid.js, dark mode e step-through
Ver no GitHubSkill agentic para criar diagramas técnicos profissionais como arquivos HTML interativos e autossuficientes, alimentado por Mermaid.js. Inclui 11 tipos de diagramas (fluxogramas, sequência, ER, máquinas de estado, etc.), modo escuro, reveal passo-a-passo e exportação em PNG/SVG/PDF.
Instalação
npx convez-ai varkart/visualcave1 comando no terminal: detecta o formato do repositório (marketplace ou plugin avulso) e instala via Claude Code. Requer Node 18+ e o Claude Code instalado.
Métricas
Casos de uso
- Documentar arquitetura de sistemas e pipelines de dados
- Criar walkthroughs interativos de processos técnicos (OAuth, RAG, Transformers)
- Gerar diagramas UML, máquinas de estado e fluxogramas para design de software
- Exportar diagramas para apresentações e documentação (PNG/SVG/PDF)
Veredito

Ferramenta bem executada para visualização técnica com suporte robusto a múltiplos tipos de diagrama e integração seamless em IDEs baseadas em IA. Ideal para equipes que precisam documentar arquitetura com interatividade sem overhead de ferramentas pesadas.
README
A tradução para o português deste README ainda está na fila.
visualcave


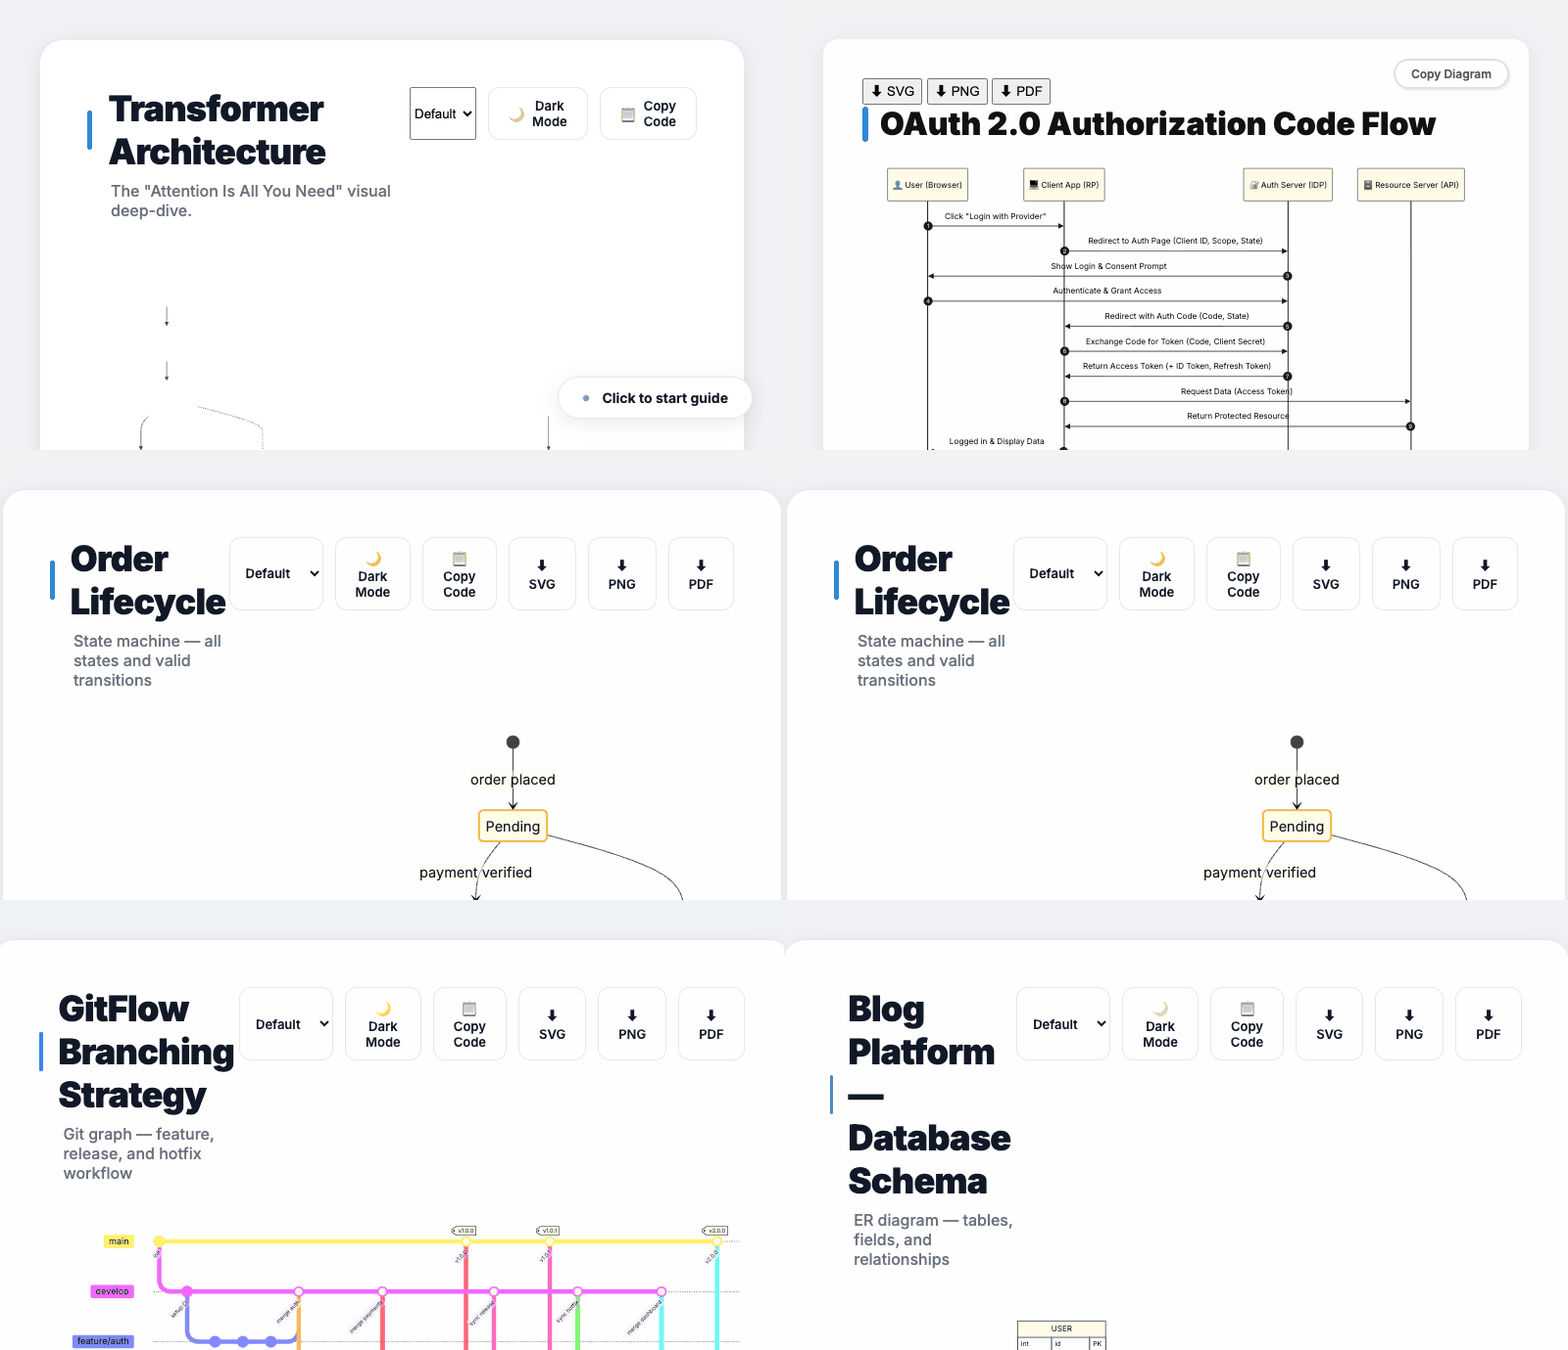
An agentic skill for creating professional technical diagrams as interactive standalone HTML files. Powered by Mermaid.js — supports 11 diagram types including flowcharts, sequence diagrams, ER diagrams, class diagrams, git graphs, mind maps, and more. Dark mode, step-through reveal, and export (PNG/SVG/PDF) built in.
Works with Claude Code, Cursor, Codex CLI, and Gemini CLI.
Installation
Claude Code (global)
git clone https://github.com/varkart/visualcave ~/.claude/skills/visualcave
Claude Code (per-project)
git clone https://github.com/varkart/visualcave .claude/skills/visualcave
Cursor — copy .cursor/rules/visualcave.mdc into your project's .cursor/rules/ directory.
Codex CLI — install via .codex-plugin/plugin.json or clone and reference the skill directory.
Gemini CLI — clone the repo; Gemini CLI will pick up gemini-extension.json automatically and load SKILL.md as context.
Kiro — copy .kiro/rules/visualcave.md into your project's .kiro/rules/ directory. (See issue #7 — in progress)
No restart required after installation.
Usage
See EXAMPLES.md for real prompts and patterns showing what to ask for and what output to expect.
Invoke with /visualcave in your AI assistant, then describe your diagram:
/visualcave — how OAuth 2.0 works
/visualcave — interactive walkthrough of a RAG pipeline
/visualcave — Transformer architecture "Attention Is All You Need"
/visualcave — order lifecycle state machine with all edge cases
/visualcave — GitFlow branching strategy with release and hotfix branches
Outputs a single self-contained .html file. Open it in any browser — no build step, no server.
Key Features
- 11 diagram types — flowchart, sequence, class, ER, state machine, quadrant, timeline, mind map, git graph, pie, gantt
- Interactive step-through — click to reveal phases one by one (ideal for architecture walkthroughs)
- Dark / light mode toggle — smooth CSS transition, respects
prefers-color-scheme - Copy Mermaid source — one-click copy of the clean diagram source
- Export — PNG, SVG, PDF, animated GIF, OG social card via
capture.js - Zero dependencies at runtime — Mermaid loaded from CDN, everything else inline
Diagram Type Reference
| Intent | Mermaid keyword |
|---|---|
| Flow, pipeline, architecture, system overview | graph TD / graph LR |
| Sequence, API calls, actor interactions | sequenceDiagram |
| Class / object / domain model (UML) | classDiagram |
| State machine, lifecycle, status transitions | stateDiagram-v2 |
| Database schema, tables, entity relationships | erDiagram |
| 2×2 priority / effort-impact matrix | quadrantChart |
| History, milestones, roadmap dates | timeline |
| Brainstorm, concept map, topic overview | mindmap |
| Git branching, commits, merges | gitGraph |
| Distribution, percentage breakdown | pie |
| Project schedule, sprint plan | gantt |
Examples
All 13 examples are in examples/ and live at the showcase site.
Architecture & Flow
- Transformer Architecture — step-through, dark mode
- OAuth 2.0 Flow — sequence diagram
- API Gateway Architecture
- CI/CD Pipeline
- E-commerce Order Flow
Object & Data Models
- E-Commerce Domain Model —
classDiagram - Blog Database Schema —
erDiagram - Order Lifecycle —
stateDiagram-v2
Planning & Analysis
- Feature Priority Matrix —
quadrantChart - API Traffic Distribution —
pie
Knowledge & History
- Evolution of the Web —
timeline - System Design Topics —
mindmap - GitFlow Strategy —
gitGraph
Color Palette
Apply these classDef classes in graph and classDiagram diagrams:
| Class | Use for |
|---|---|
:::yellow | Users, browsers, entry points |
:::blue | Services, APIs, compute |
:::green | Databases, storage, success states |
:::purple | Auth, AI models, security |
:::orange | Queues, events, pipelines |
:::teal | Caching, CDN, external APIs |
:::note | Annotations, callouts |
Export
node capture.js diagram.html                    # animated GIF
node capture.js diagram.html --format=png       # PNG screenshot
node capture.js diagram.html --format=svg       # extracted SVG
node capture.js diagram.html --format=pdf       # A4 PDF
node capture.js diagram.html --format=og        # 1200×630 OG image
Development
Requires Node.js 18+ (for capture.js / puppeteer).
npm install
npx playwright install chromium
npm test             # run all diagram validation tests
npm run test:ui      # Playwright UI mode
npm run test:headed  # headed browser
Contributing
See CLAUDE.md for contribution guidelines — what's accepted, what won't be merged, and how to run tests.
License
MIT — see LICENSE.