
WaterWorks AI
smslavin/waterworks-ai
Diagnóstico IA de plantas industriais com dados MQTT, OPC-UA e InfluxDB
Ver no GitHubMCP Server para diagnóstico de processos industriais em linguagem natural, demonstrando integração de Claude com simulação de estação de tratamento de água usando MQTT, OPC-UA e InfluxDB. Fornece leitura de dados de sensores, diagnóstico automático de falhas e proposição de ações de controle com rastreabilidade de auditoria.
Instalação
npx convez-ai smslavin/waterworks-ai1 comando no terminal: detecta o formato do repositório (marketplace ou plugin avulso) e instala via Claude Code. Requer Node 18+ e o Claude Code instalado.
Métricas
Casos de uso
- Diagnóstico automático de falhas em processos industriais
- Monitoramento e análise preditiva de estações de tratamento
- Integração de IA natural language com sistemas SCADA/OPC-UA
- Rastreamento de auditoria e aprovação de ações de controle
Veredito

Demonstração industrial robusta e reproduzível que combina MCP com arquitetura de IoT real (MQTT, OPC-UA, InfluxDB). Excelente referência de implementação para diagnóstico IA em ambientes de produção, embora exija infraestrutura local estabelecida.
README
A tradução para o português deste README ainda está na fila.
WaterWorks AI




Everything in this stack is open source. No proprietary historians, SCADA platforms or cloud connectors required.
Contents
- Why this exists
- Screenshots
- How it works
- Prerequisites
- Quick start
- Windows quick start
- Process units
- Fault injection
- Audit and control
- Demo sequence
- Dashboards
- Context management
- Multi-agent diagnostic mode
- Agent memory
- Configuration
- Project layout
- Extending
Why this exists
Exploring natural language interfaces for industrial systems raises a practical problem. Most demonstrations require proprietary SCADA licenses, historian software or cloud connectors to reproduce. The architecture and reasoning patterns are interesting. The access requirements get in the way of evaluating them.
This stack uses only open source components. MQTT, OPC-UA, InfluxDB, Grafana, Python. Clone it, run it, see exactly how every layer works.
The fault injection engine makes diagnostic quality verifiable rather than claimed. Inject a known fault, ask the AI what's happening, evaluate the reasoning yourself. The AI doesn't know what was injected. It reads live sensor data, cross-references historical trends and tells you what it found.
The control layer shows what it looks like to give an AI agent write access to a process system with a human in the loop. The AI proposes an action, the operator approves or denies, and both outcomes are recorded with equal fidelity — denial is not a second-class event.
The water treatment plant is a starting point. The architecture transfers to any industrial system with MQTT or OPC-UA data sources.
Screenshots
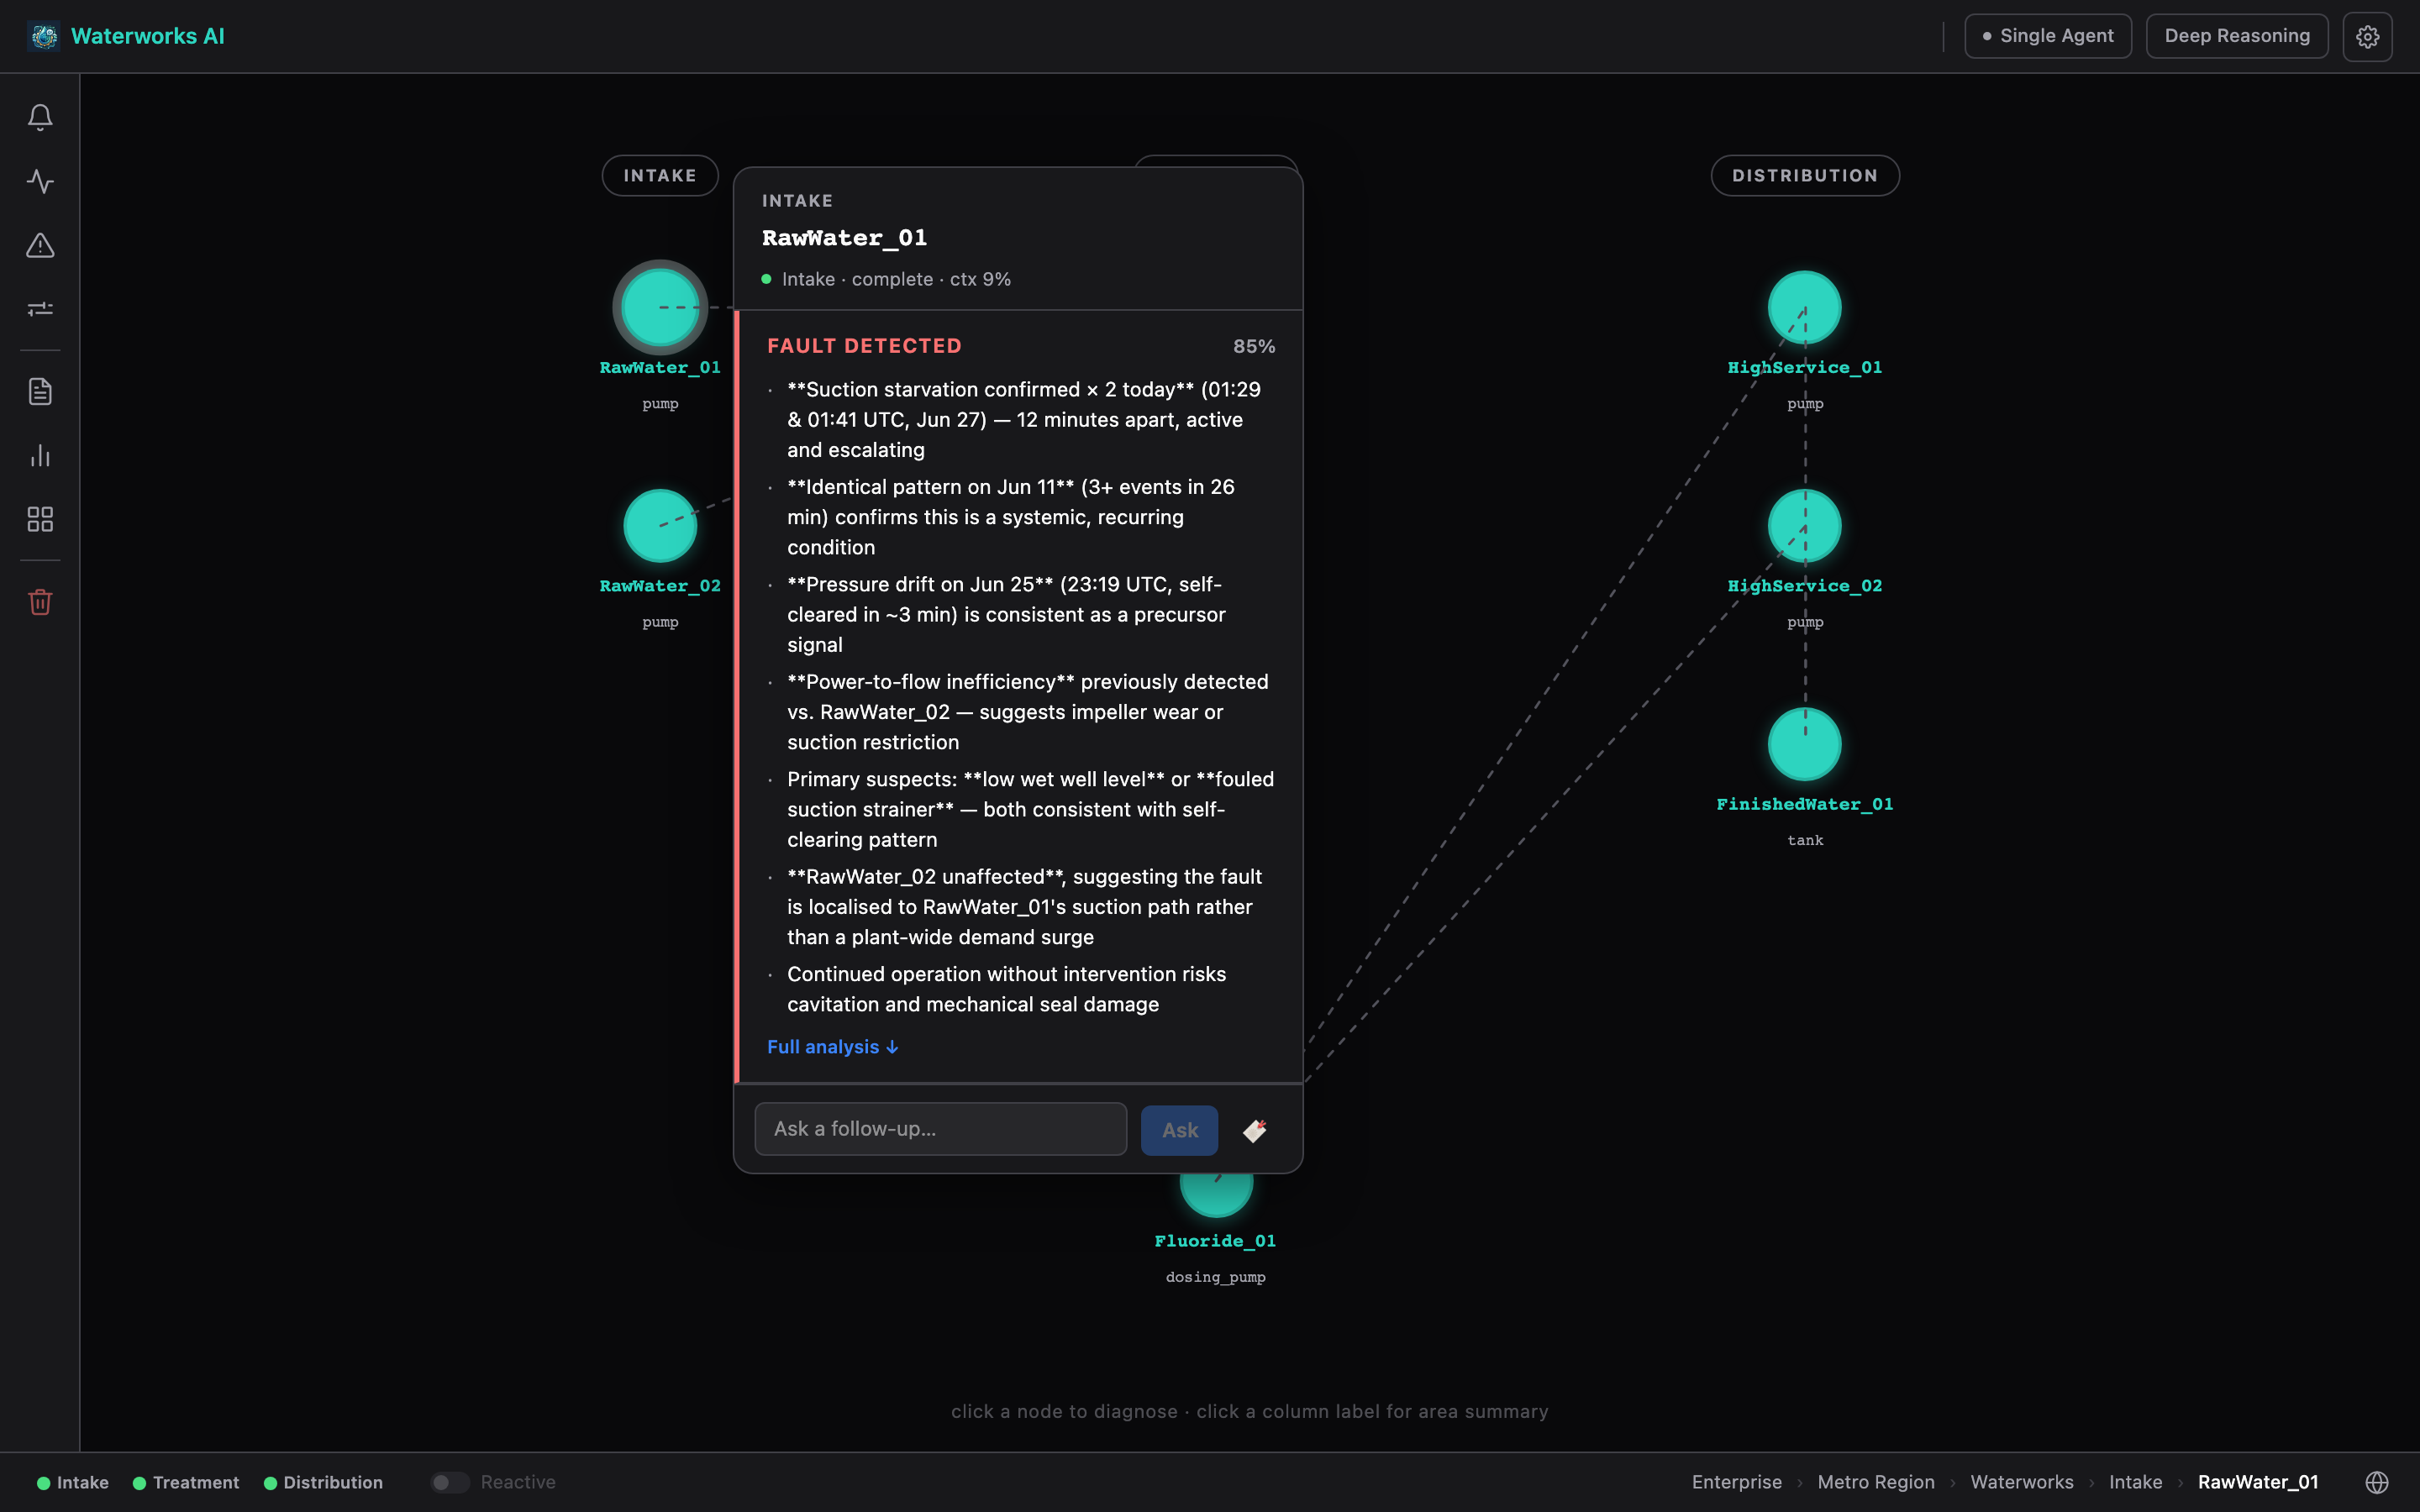
Natural language fault diagnosis
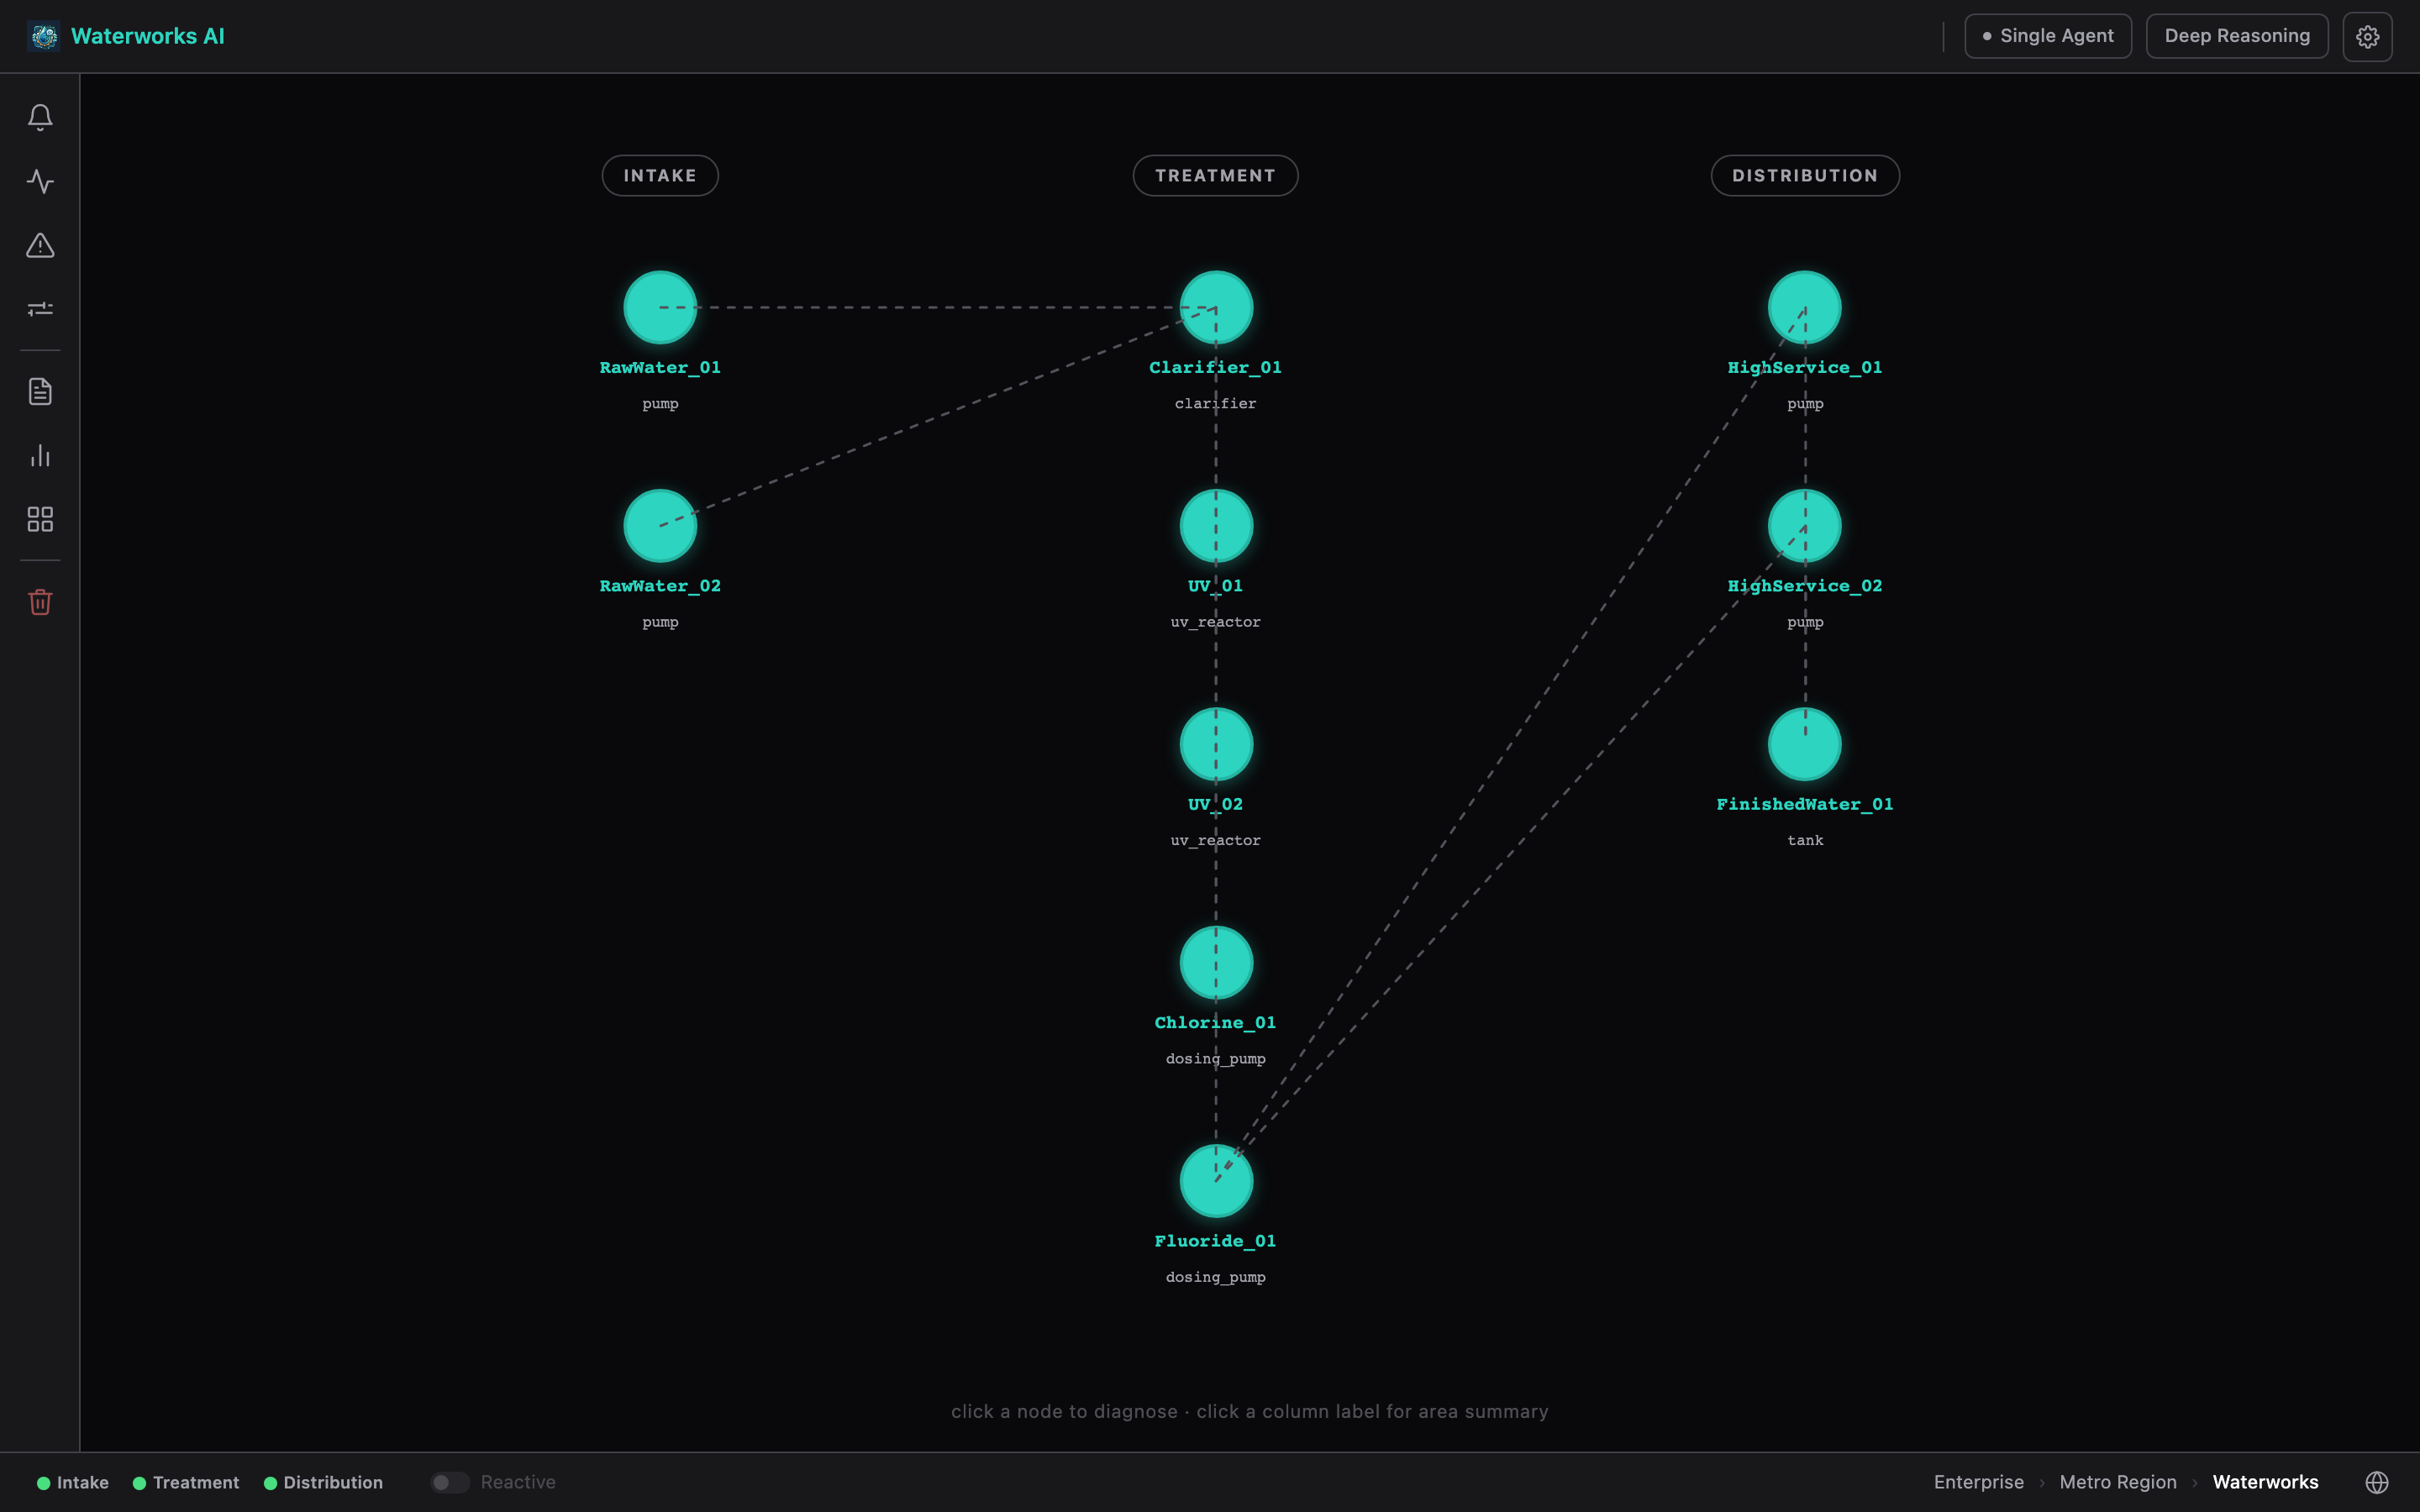 Suction starvation injected on RawWater_01. The AI reads live sensor
data, queries fault history from InfluxDB, and identifies the condition
without being told where to look.
Plant health overview
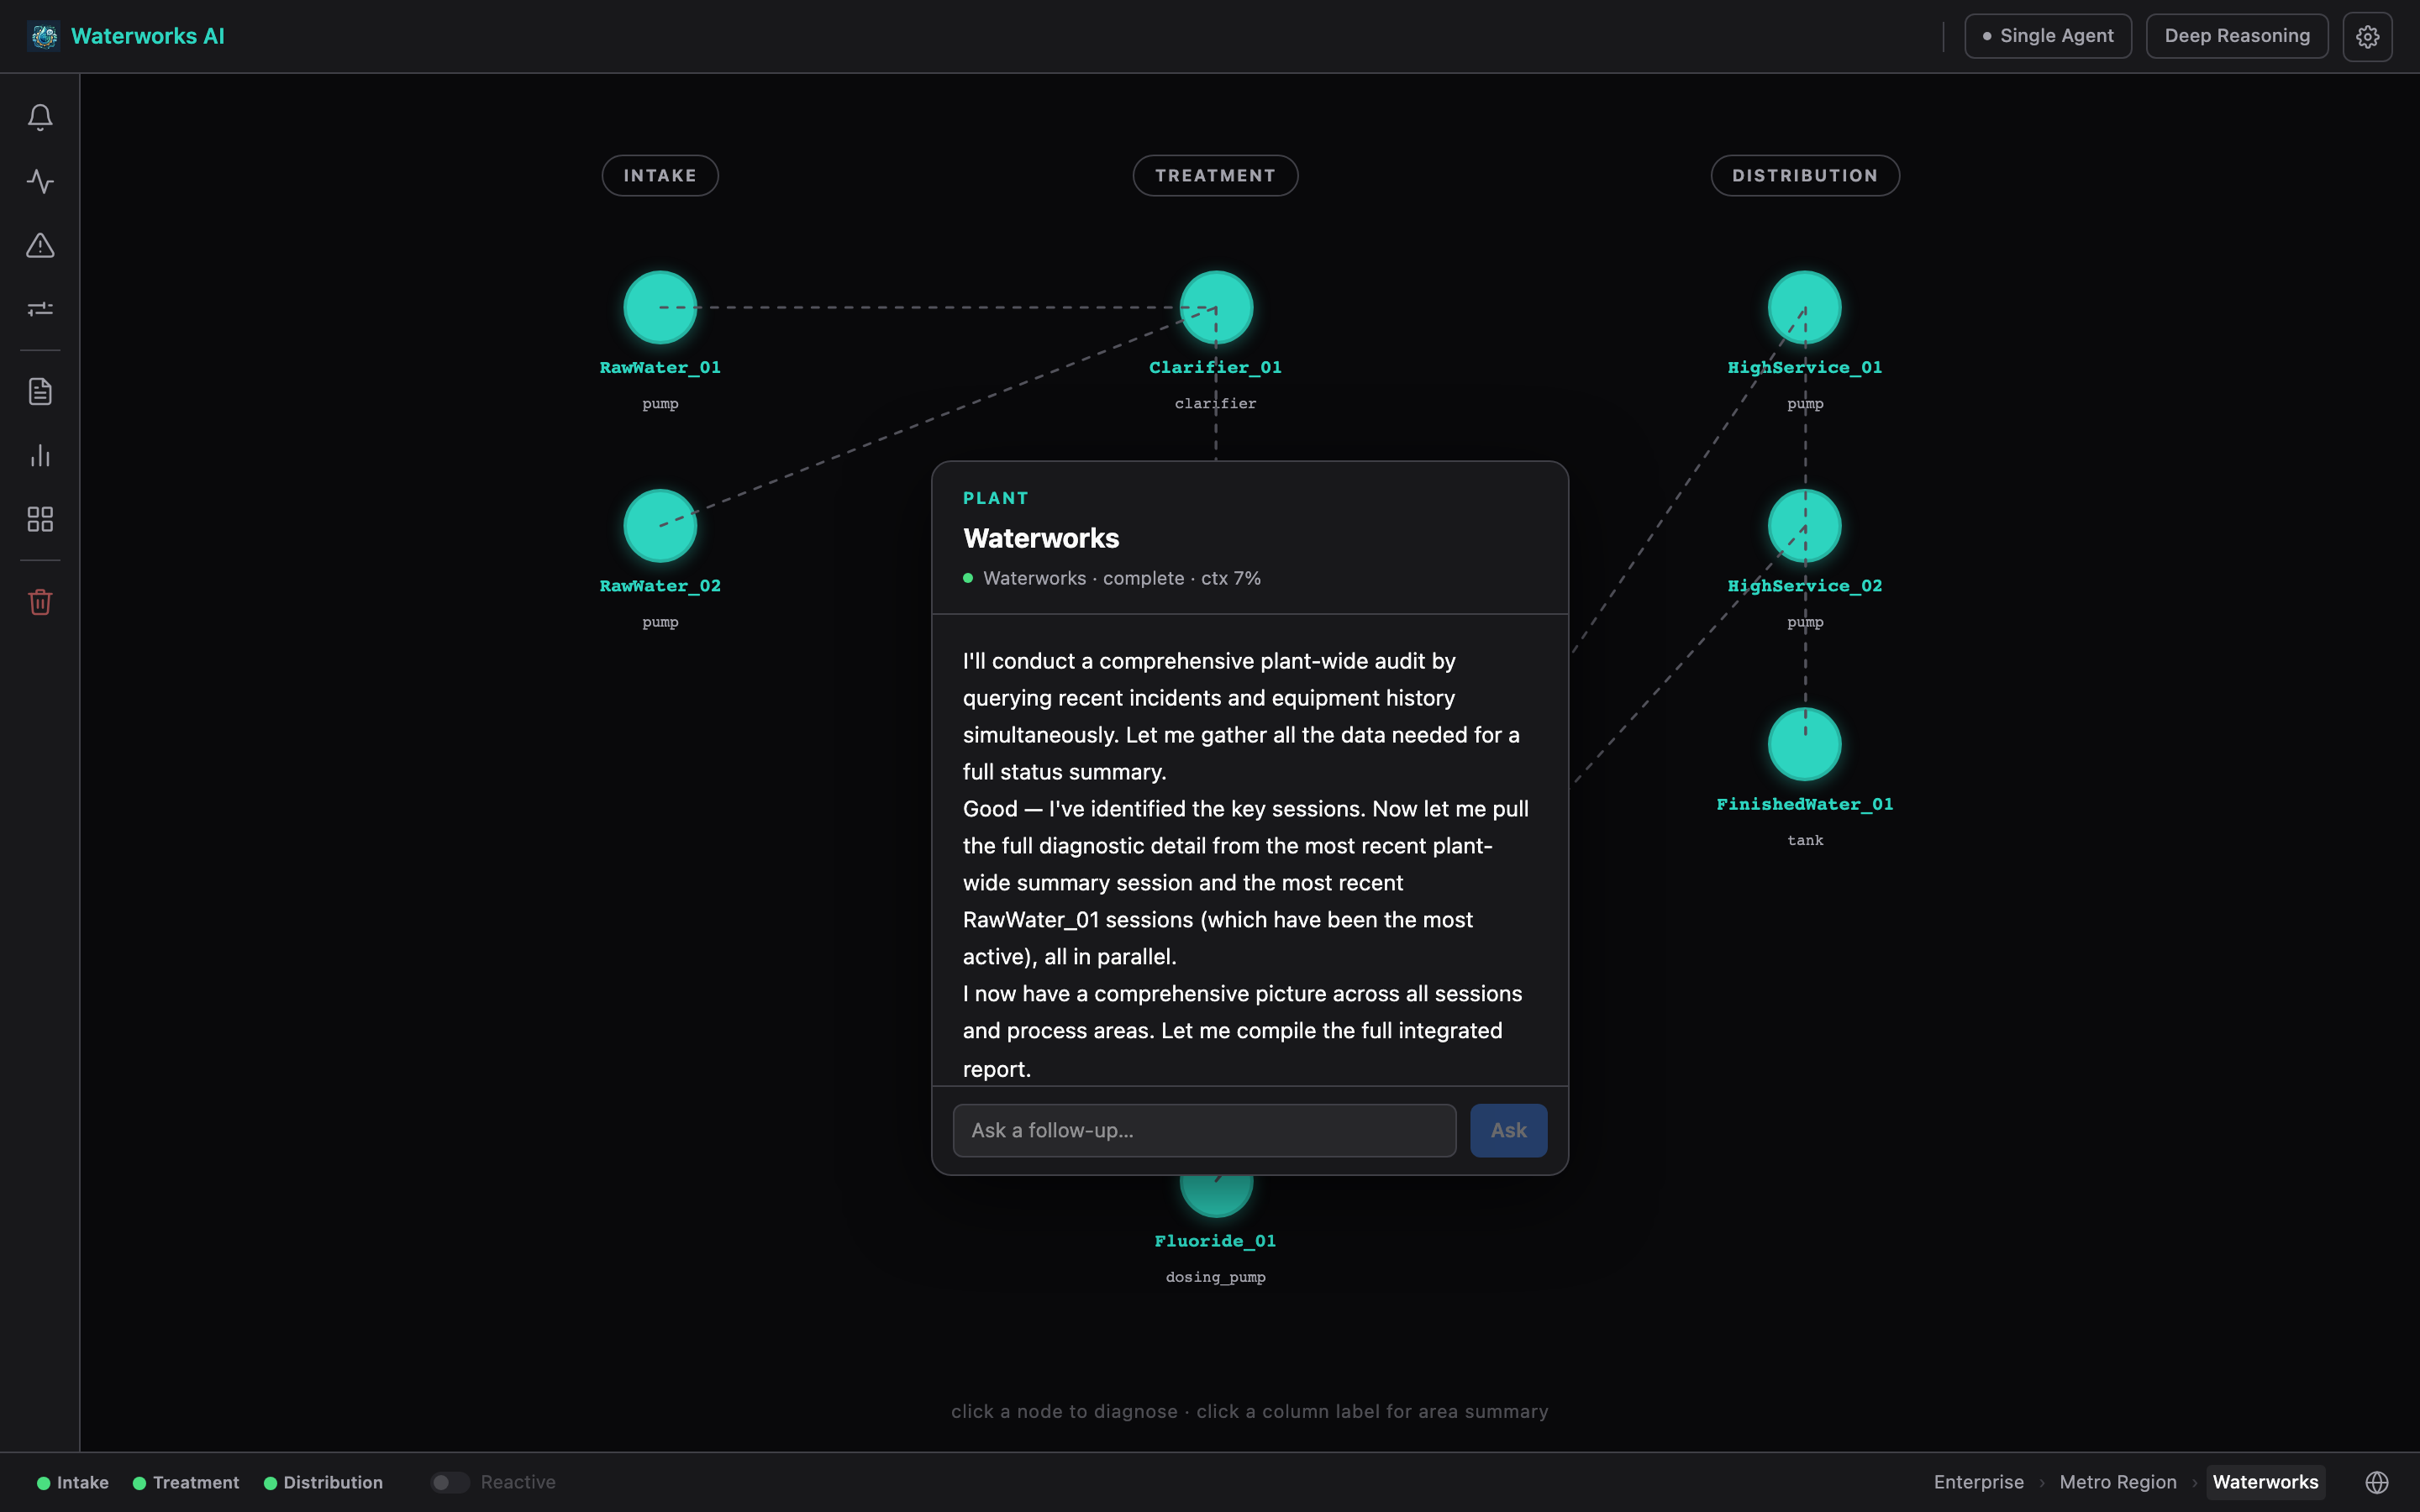 Full plant health check across all process units. The AI identifies
run-status discrepancies on three pumps from a prior session.
Process monitoring dashboard
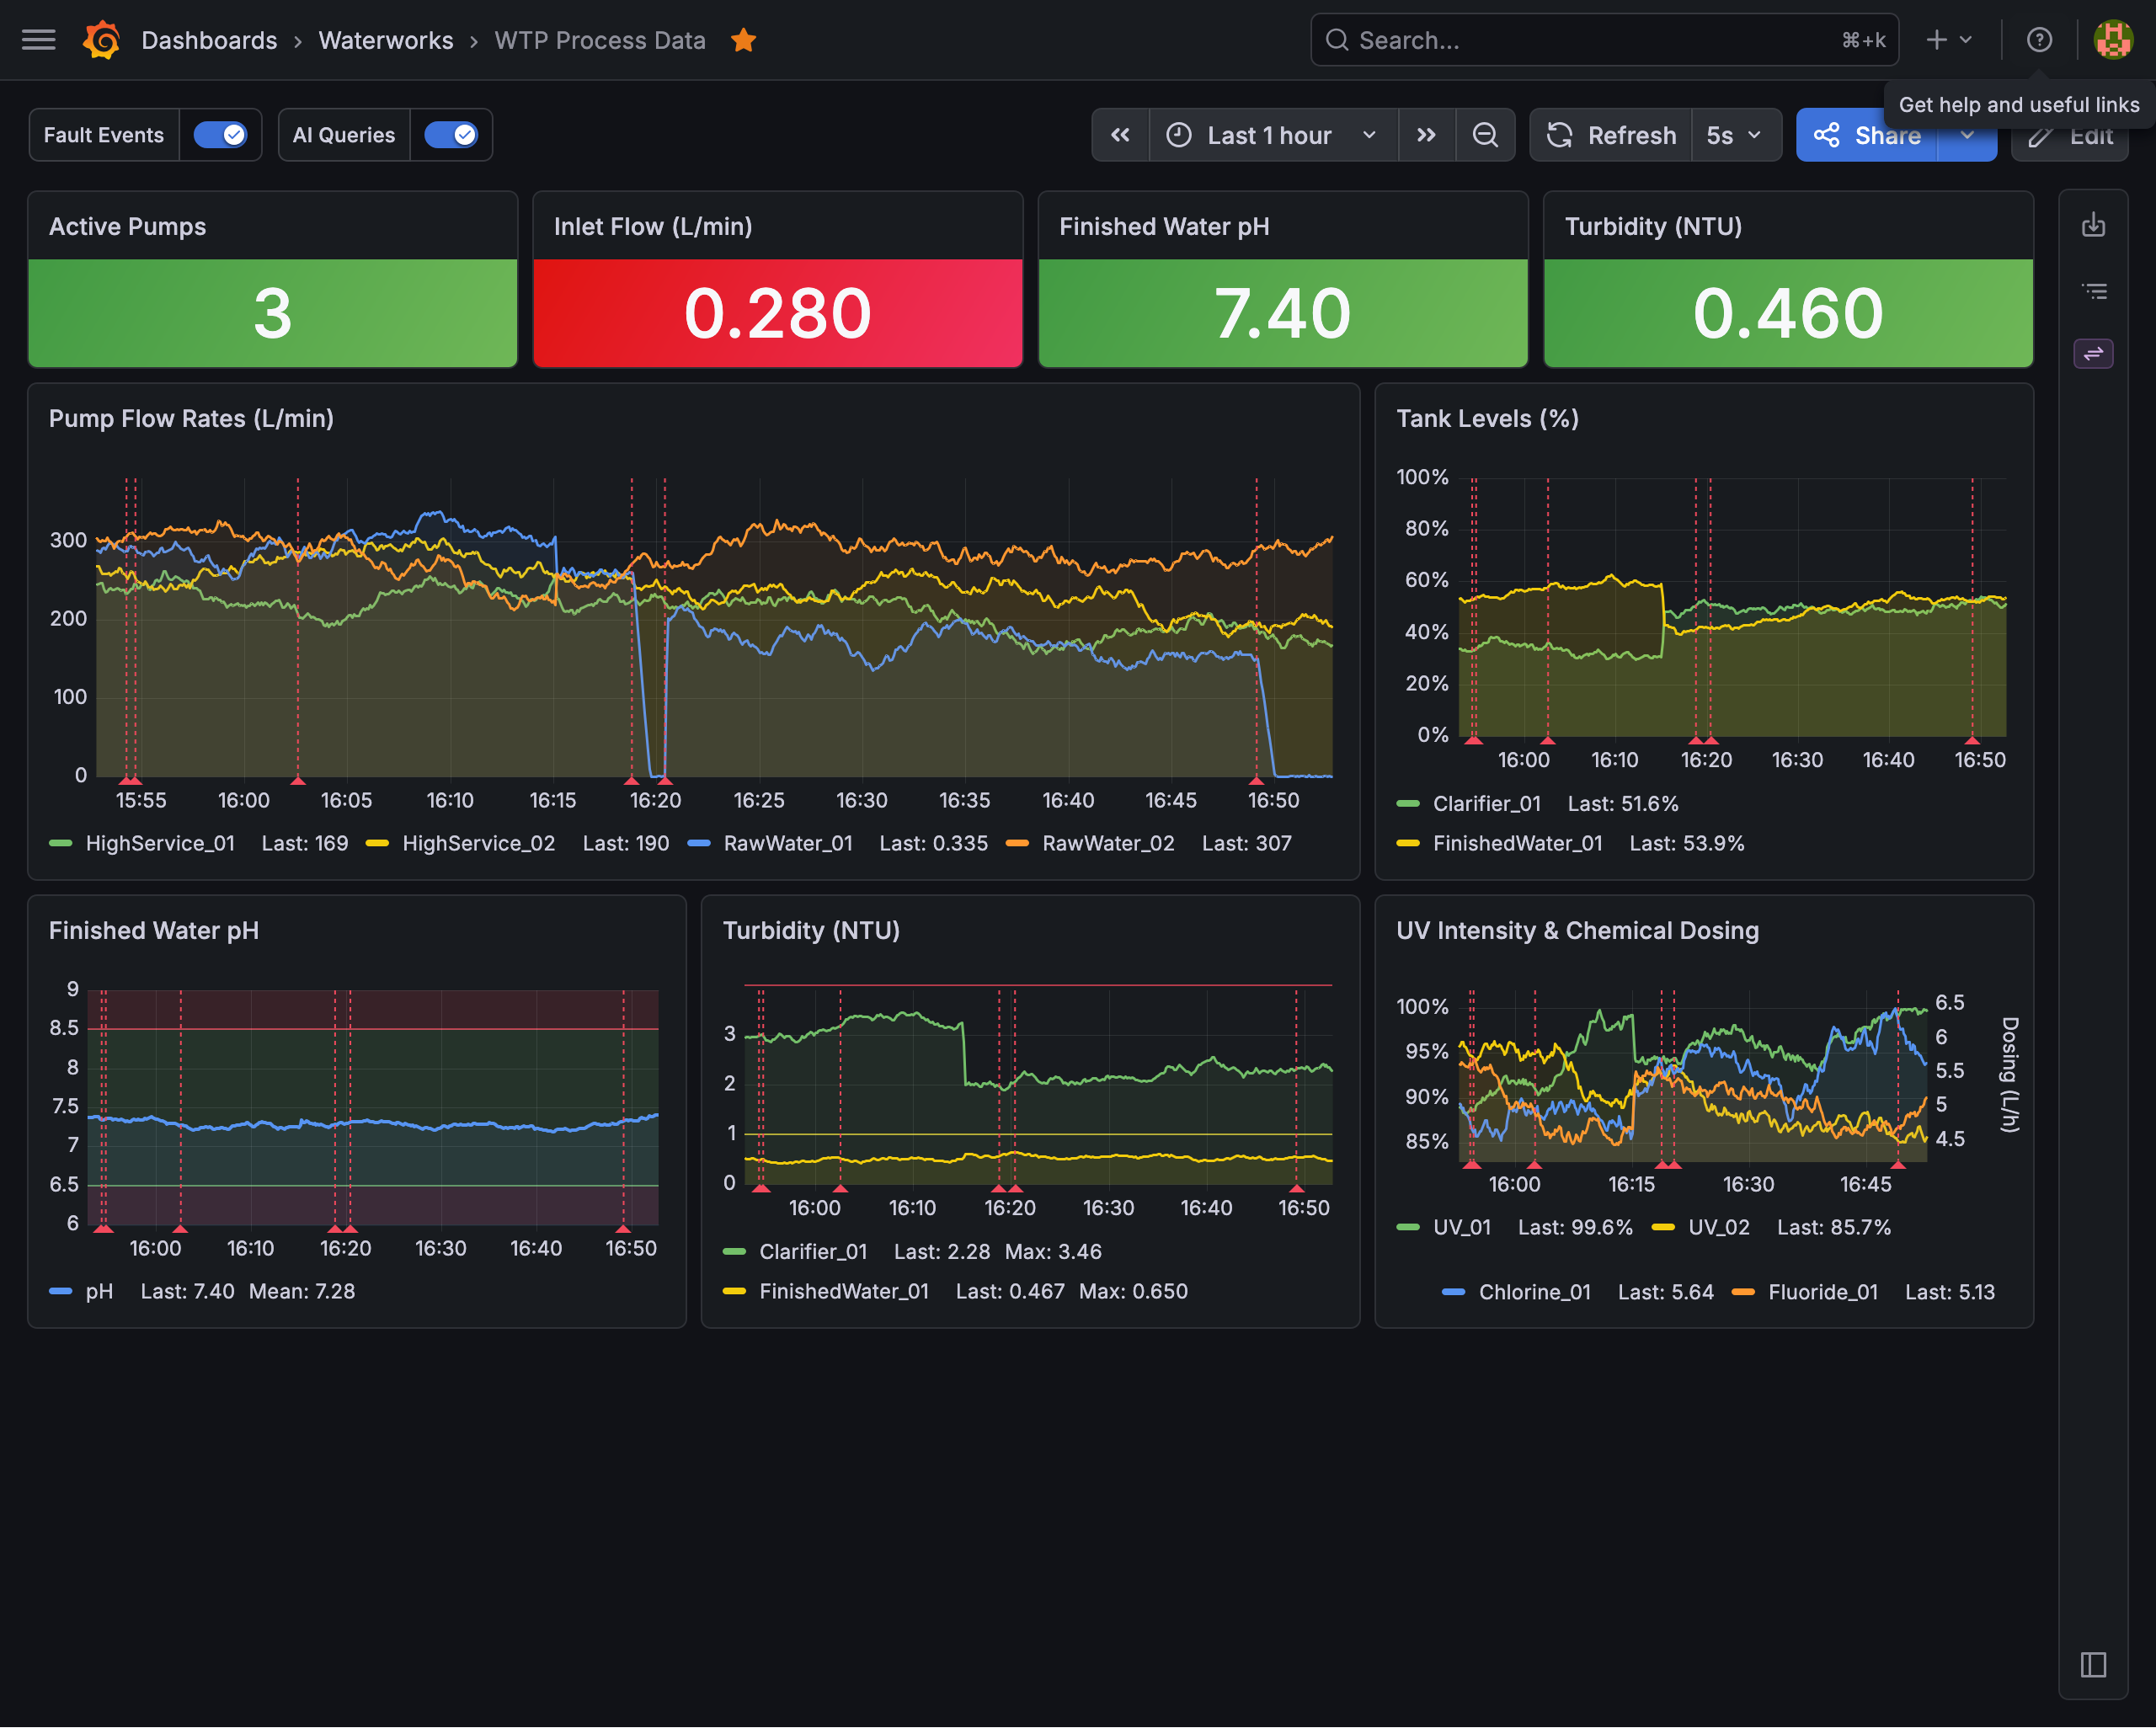 Grafana process dashboard with fault injection annotations. Red dashed
lines mark fault events across all panels simultaneously.
AI session observability
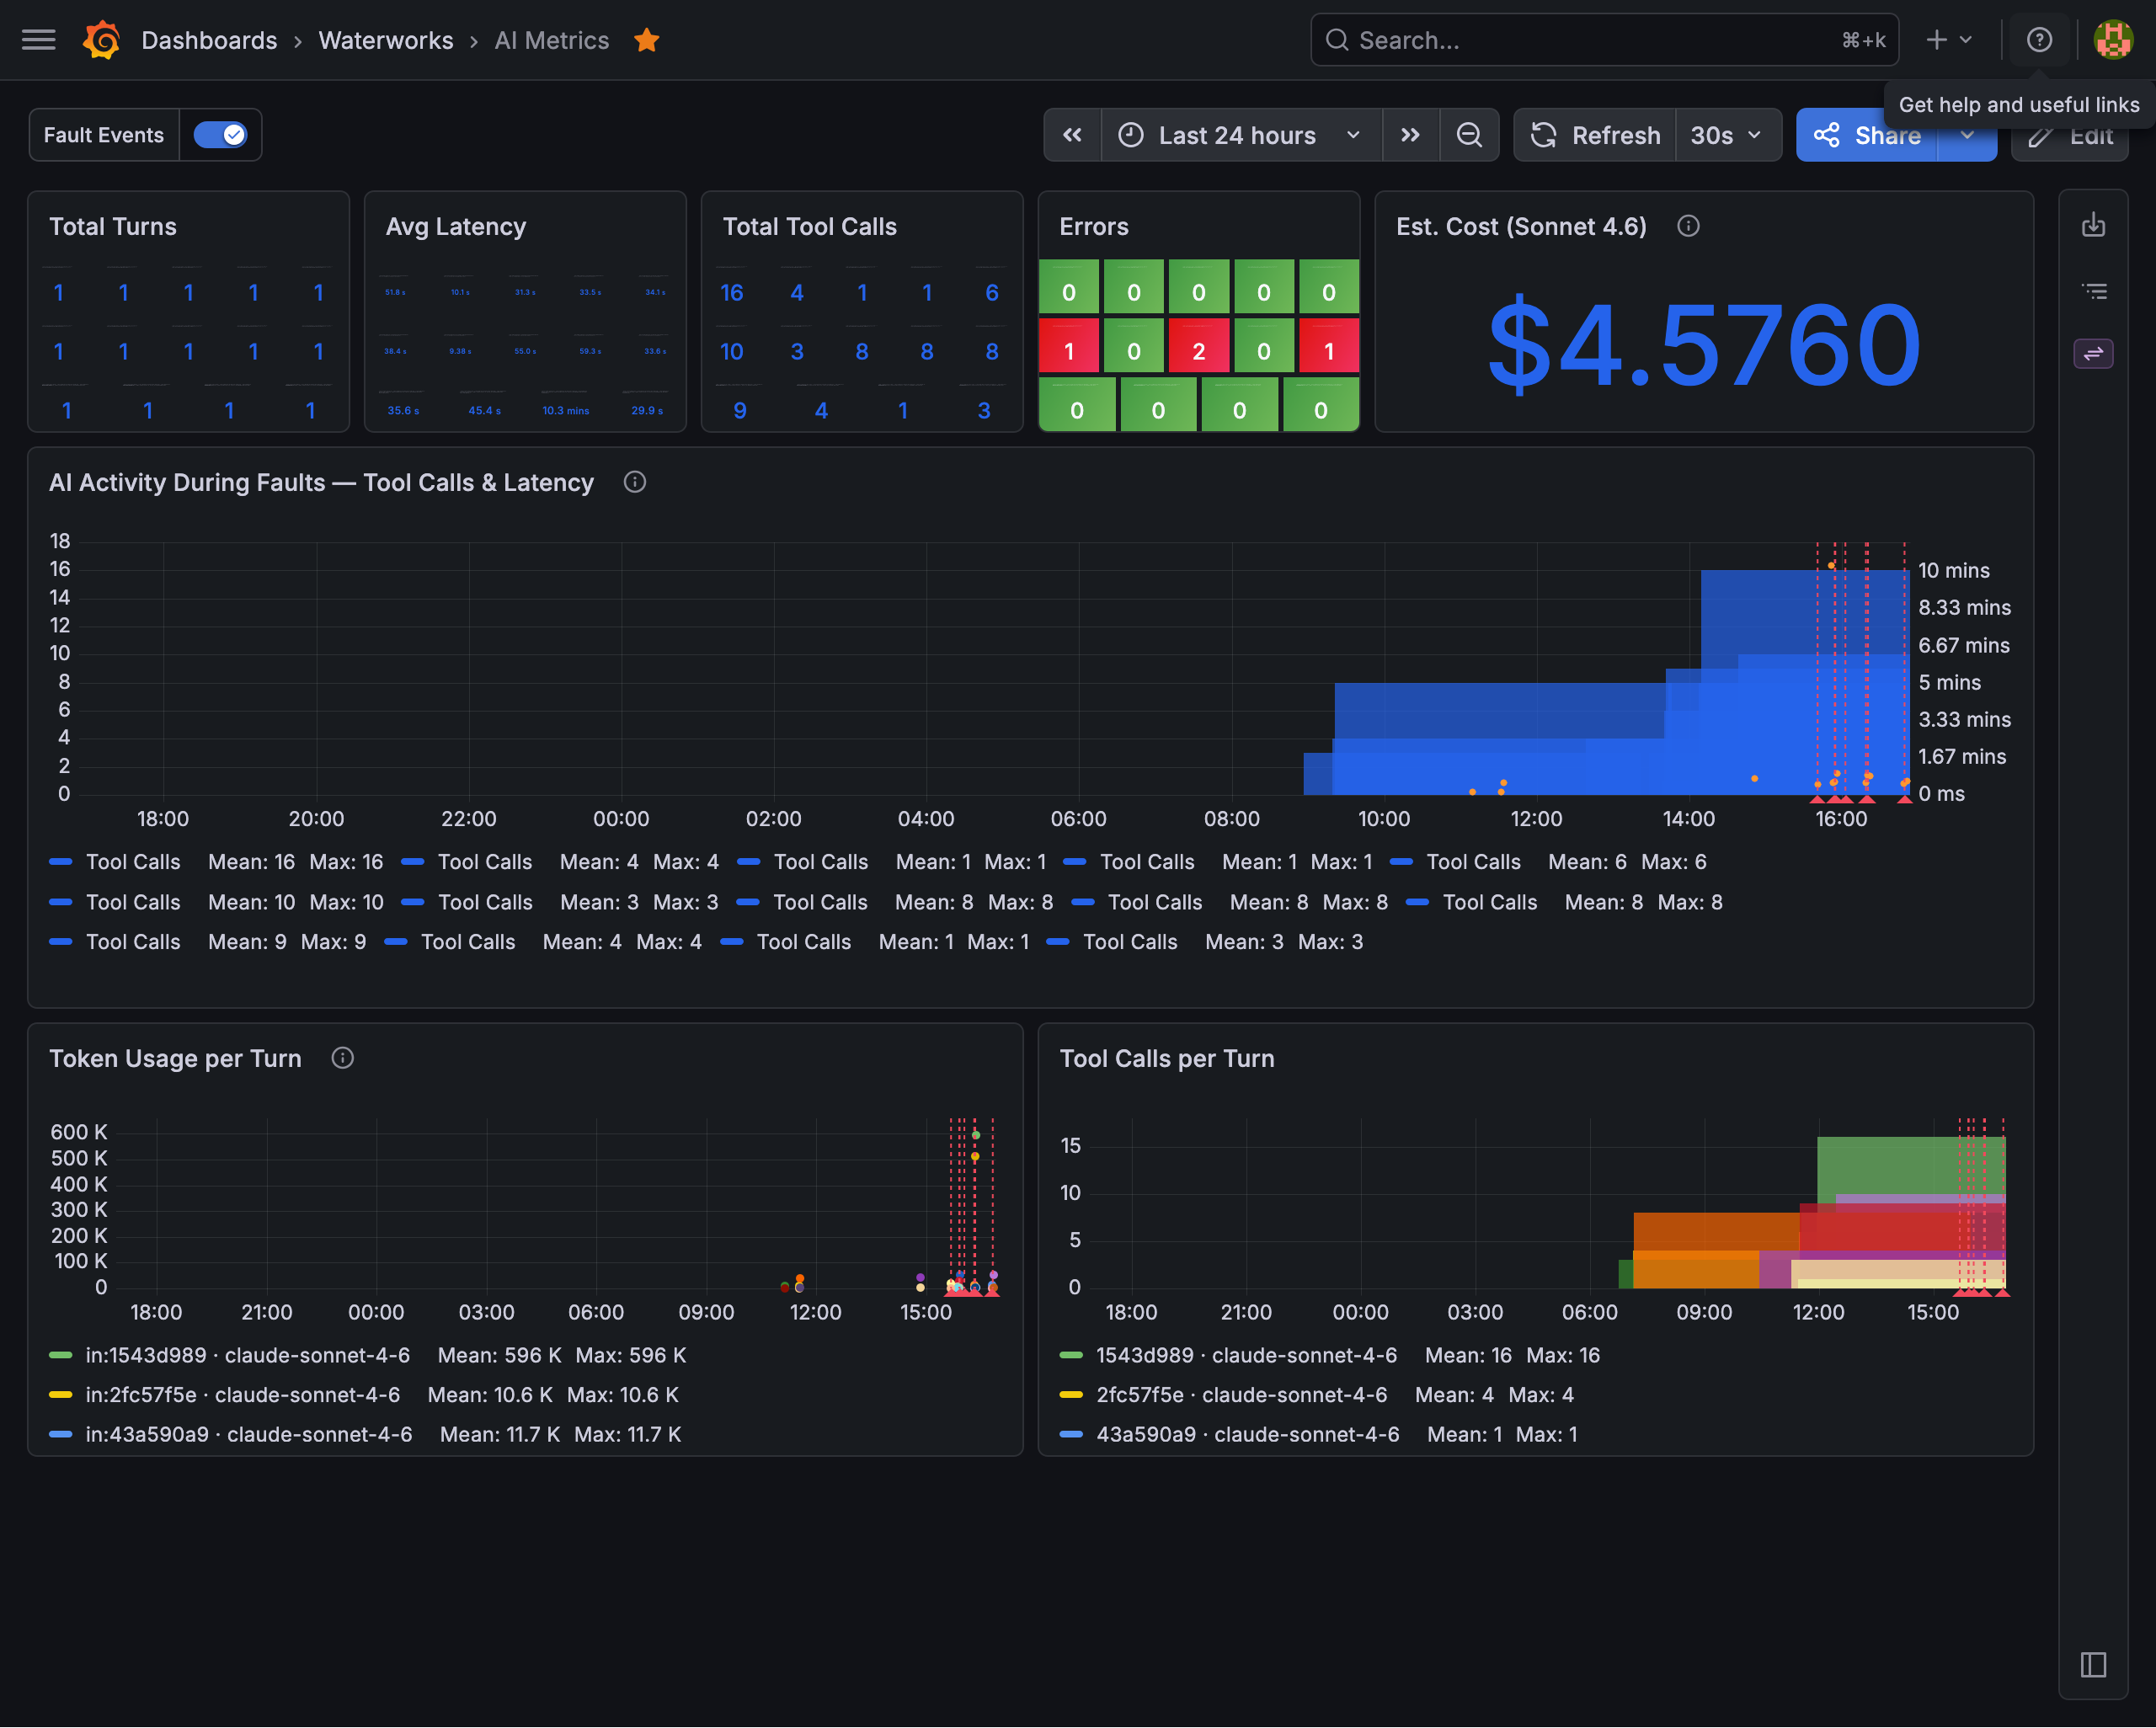 AI session telemetry alongside fault events. Tool call count and latency
spike at fault injection timestamps.
Interface
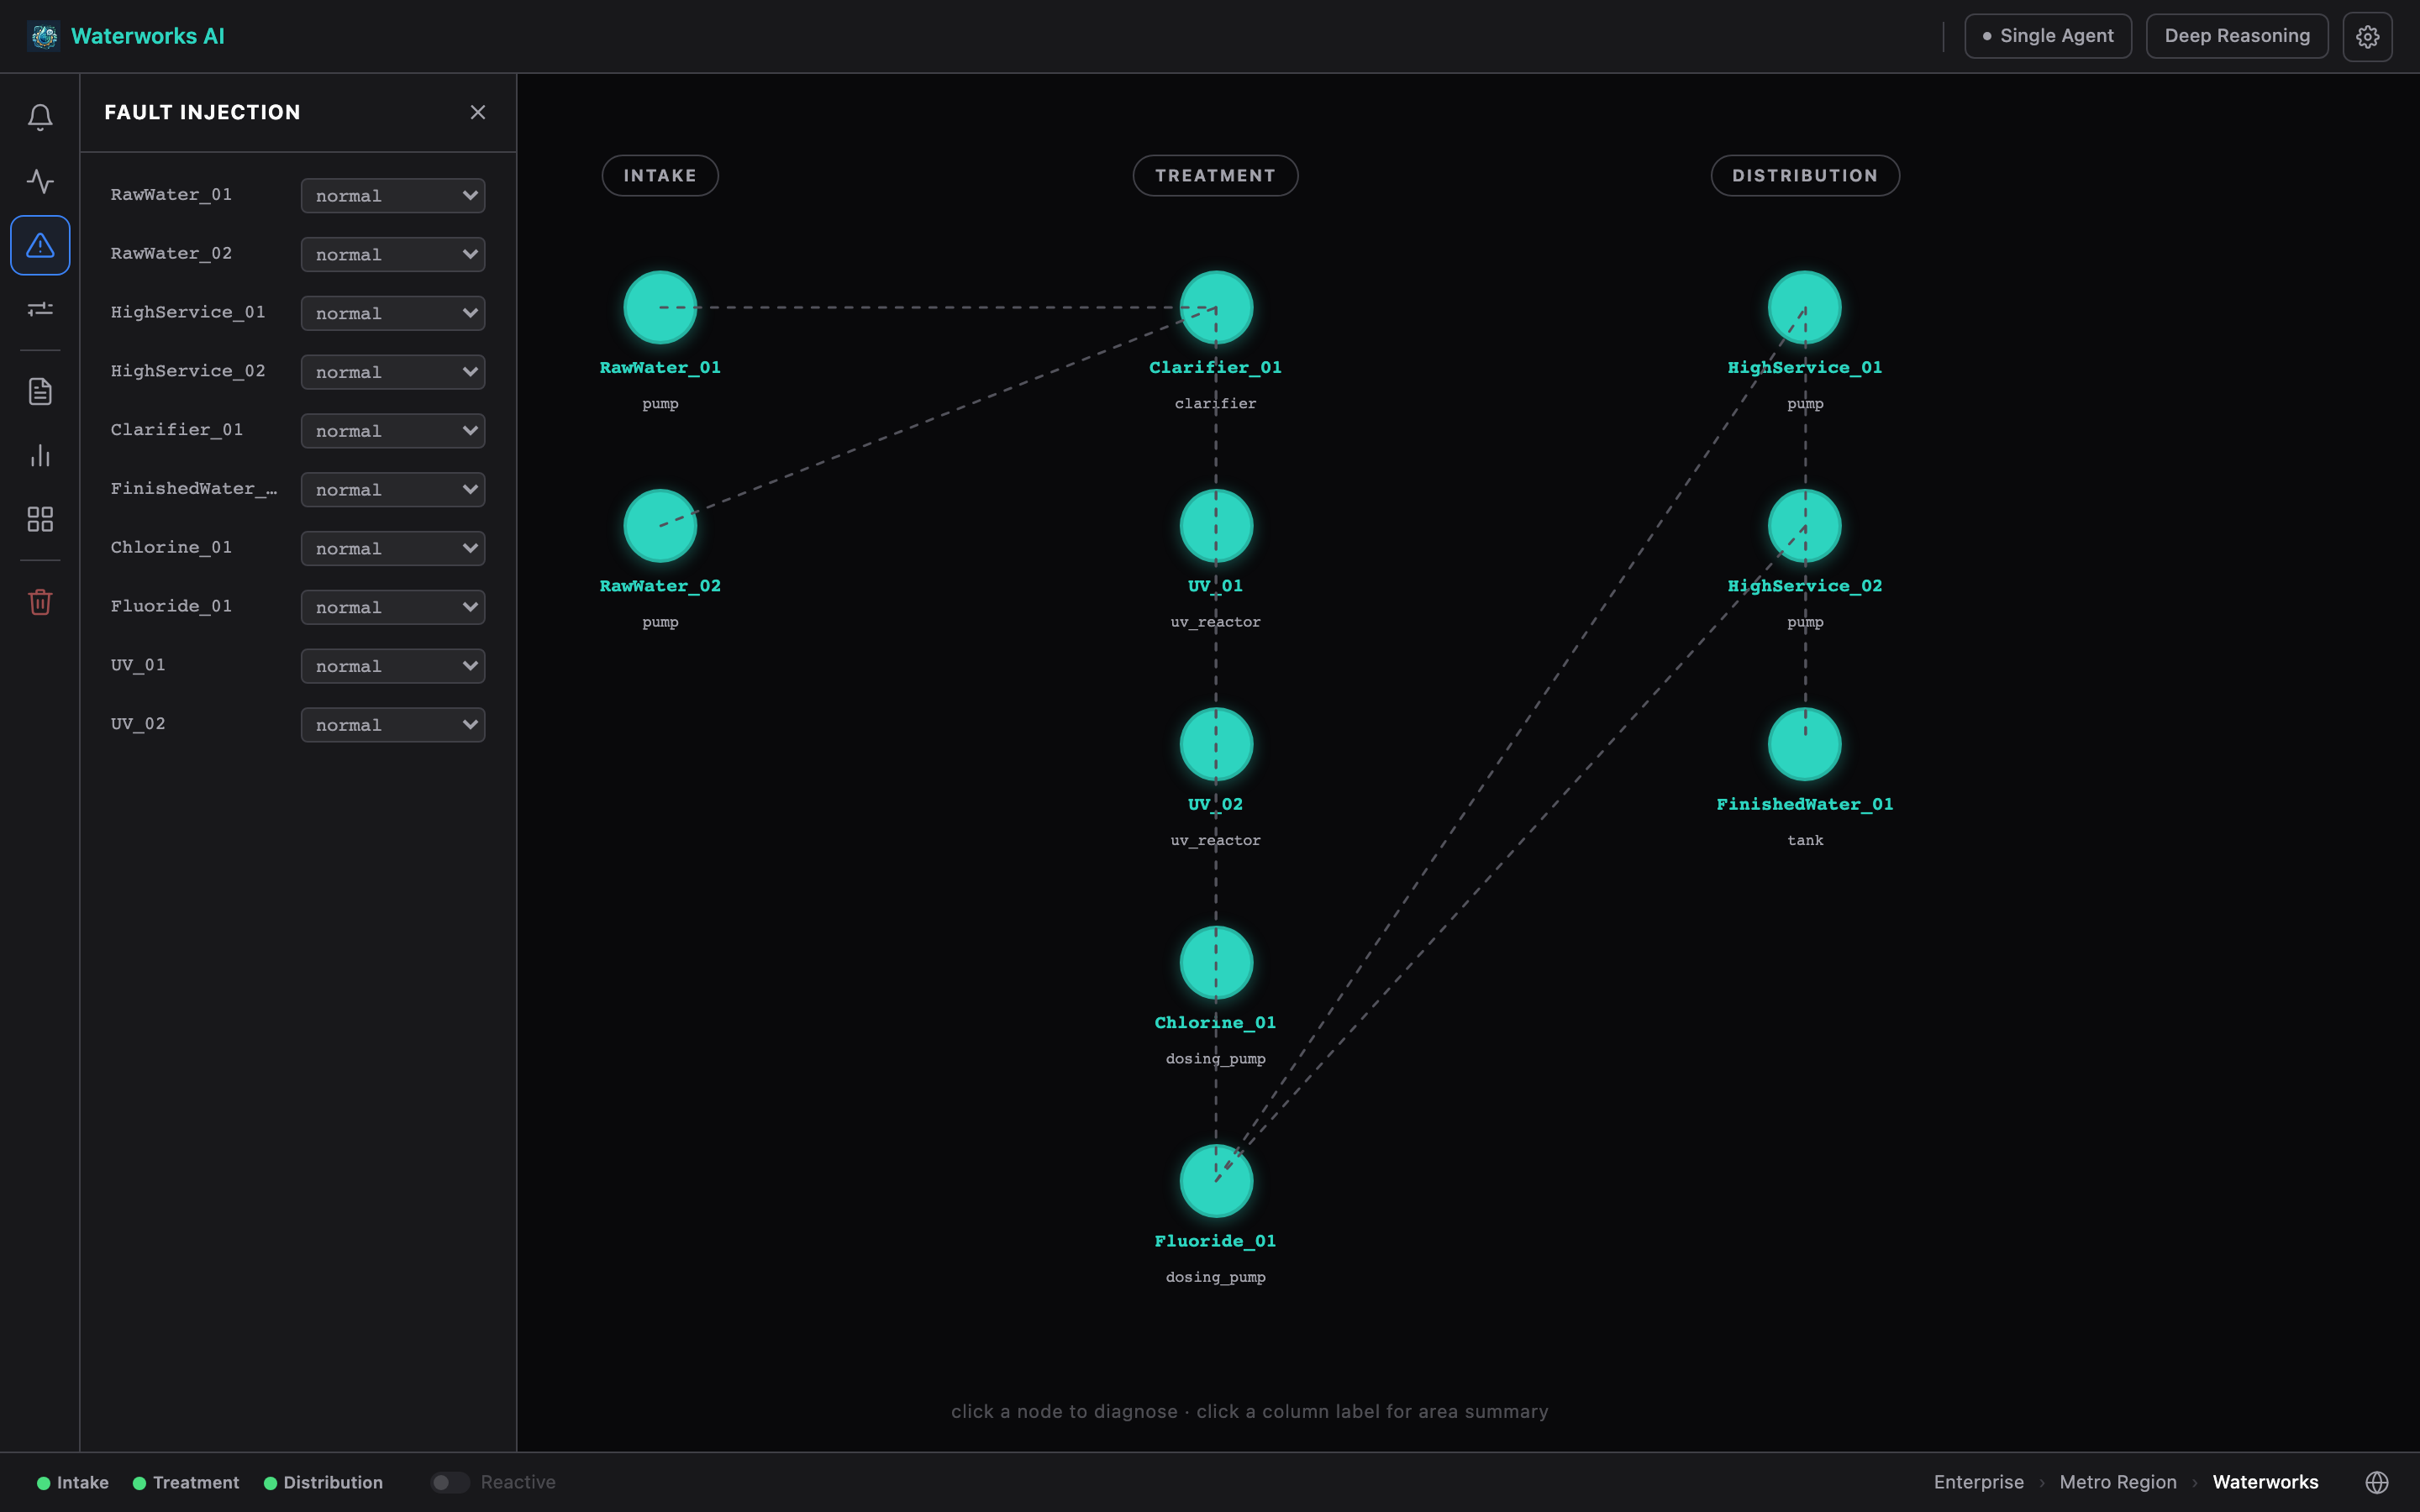 Clean interface with fault injection panel, server status indicators
and fault status panel. Deep Reasoning toggle enables extended thinking
for complex diagnostic scenarios.
Context management
 Four consecutive health overview sessions. Tool selection guidance in
the system prompt cut tool calls from 34 to 1. Latency dropped from
58.8s to 21.8s. Response quality unchanged.
Multi-agent mode
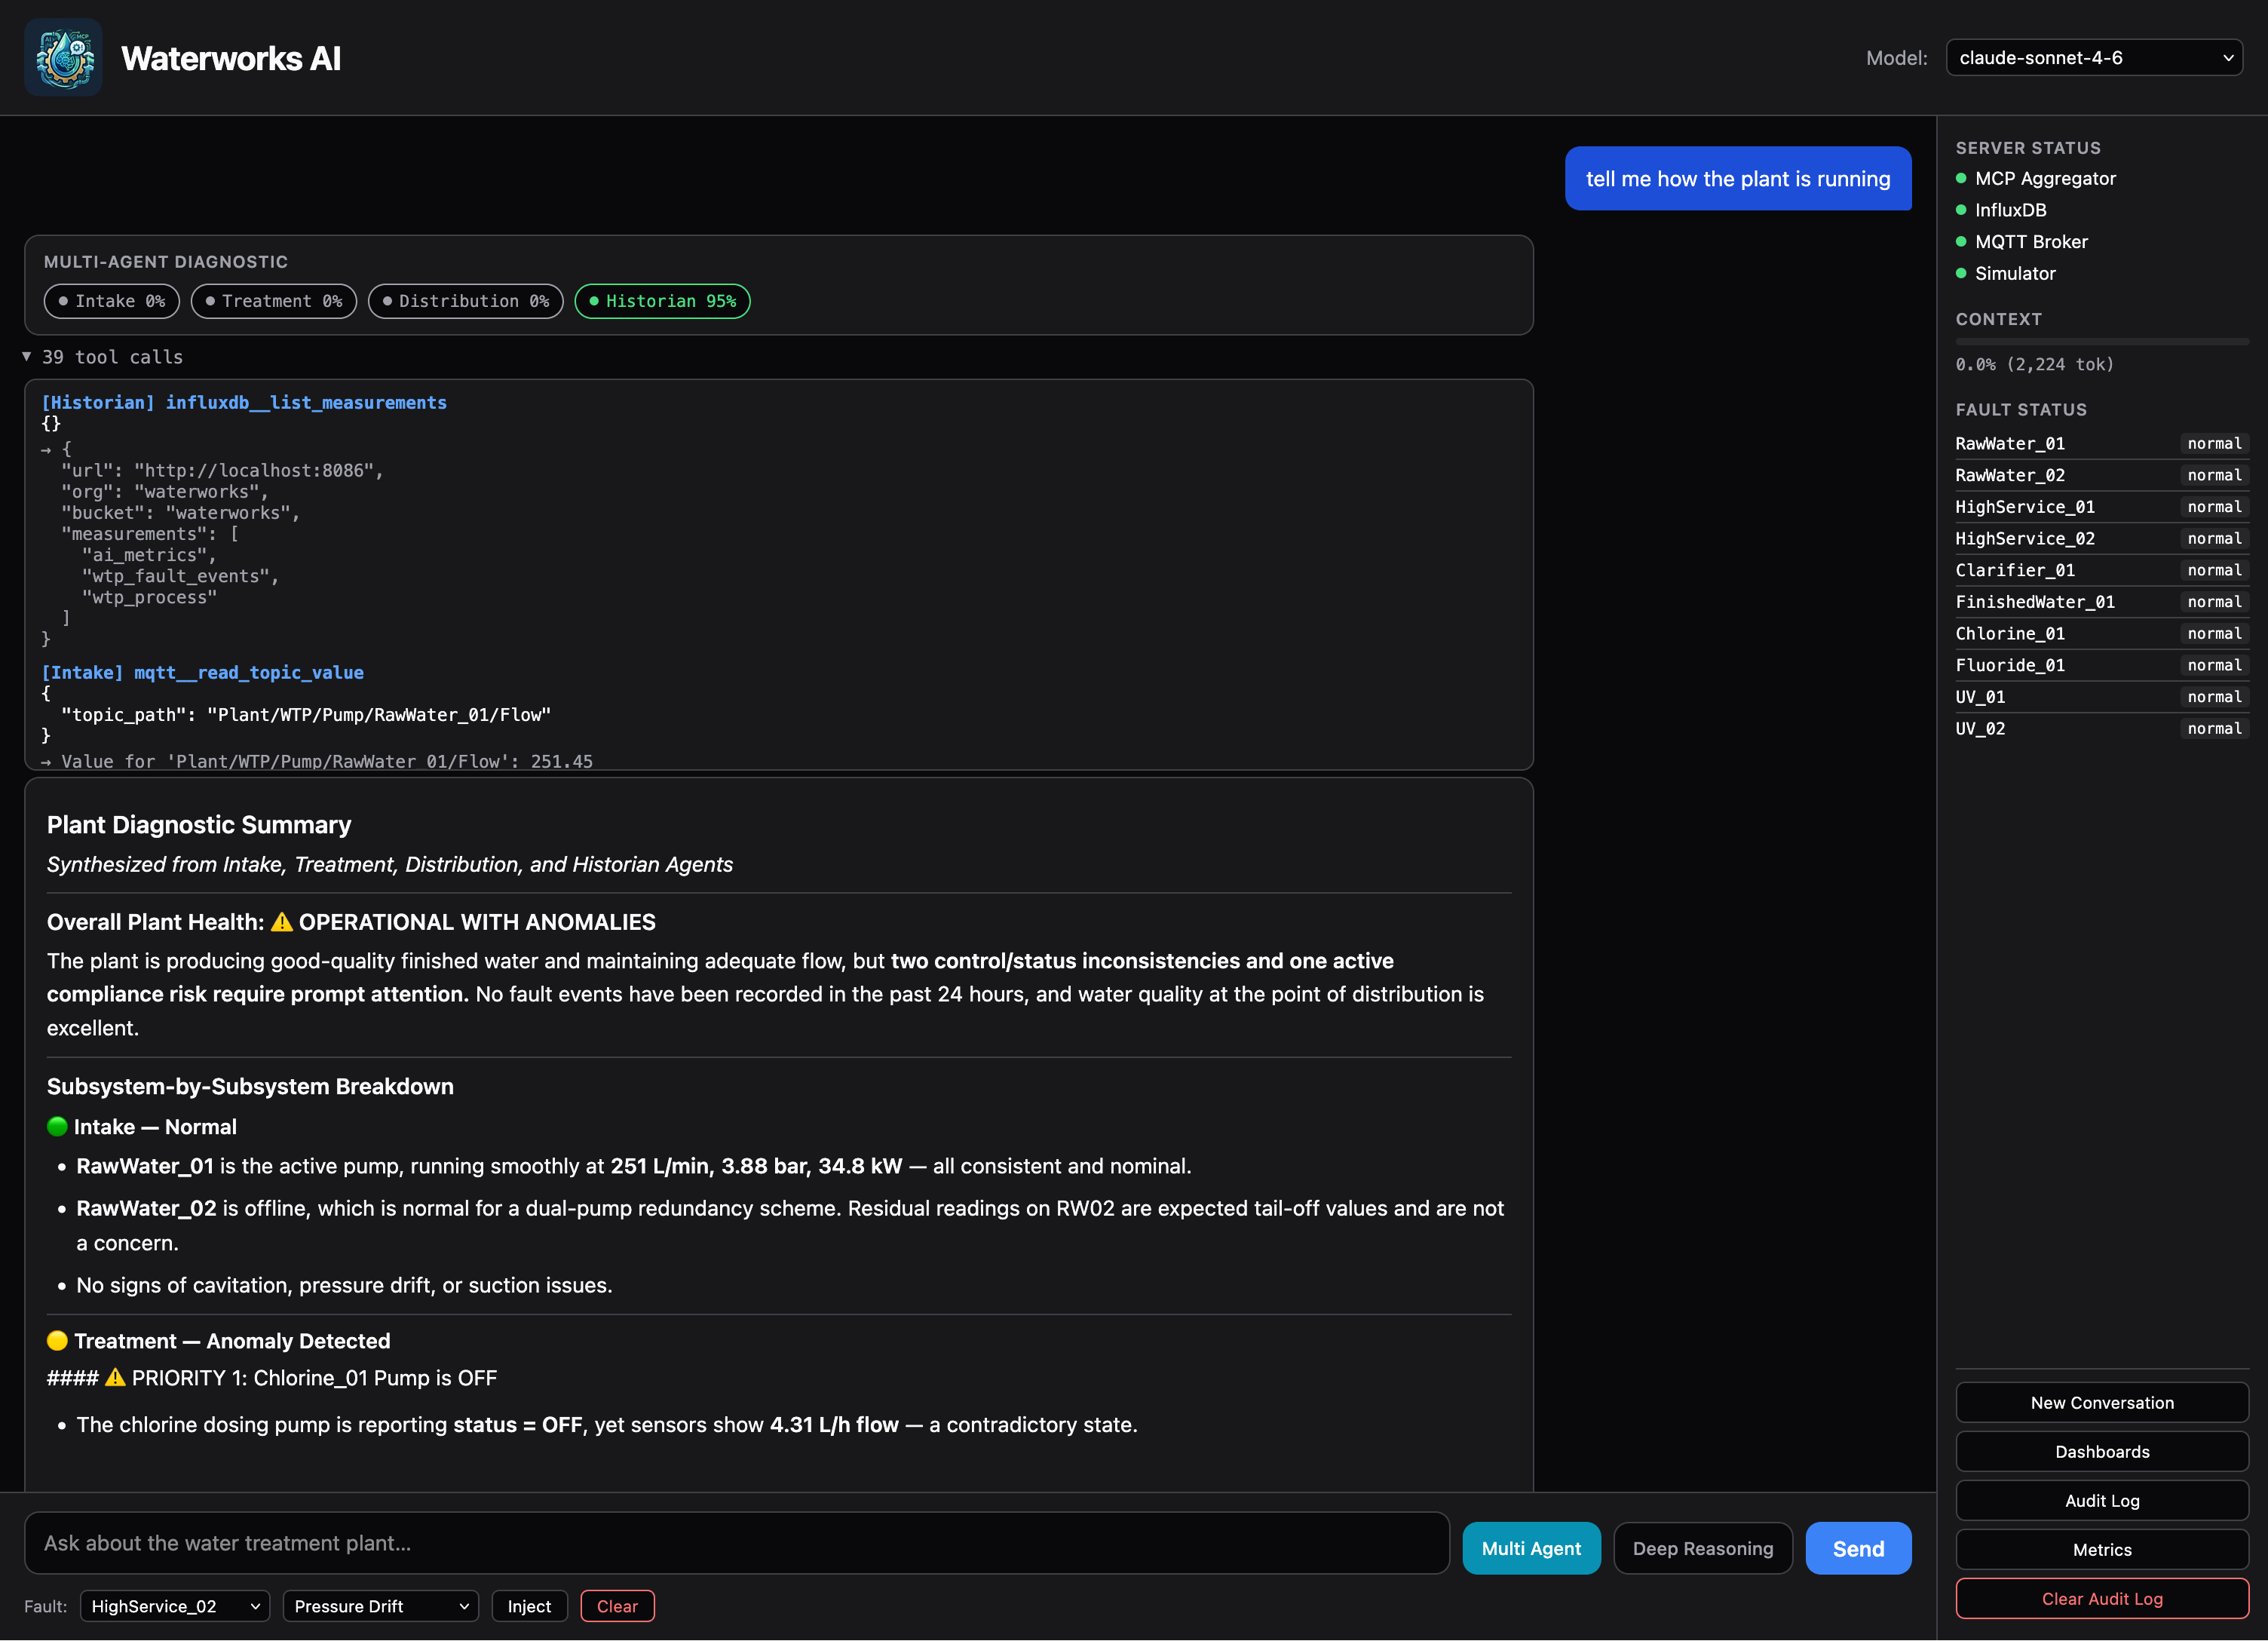 Four specialist agents run in parallel, each scoped to their domain.
The orchestrator synthesizes cross-system correlations that no single
specialist could identify.
Operator approval
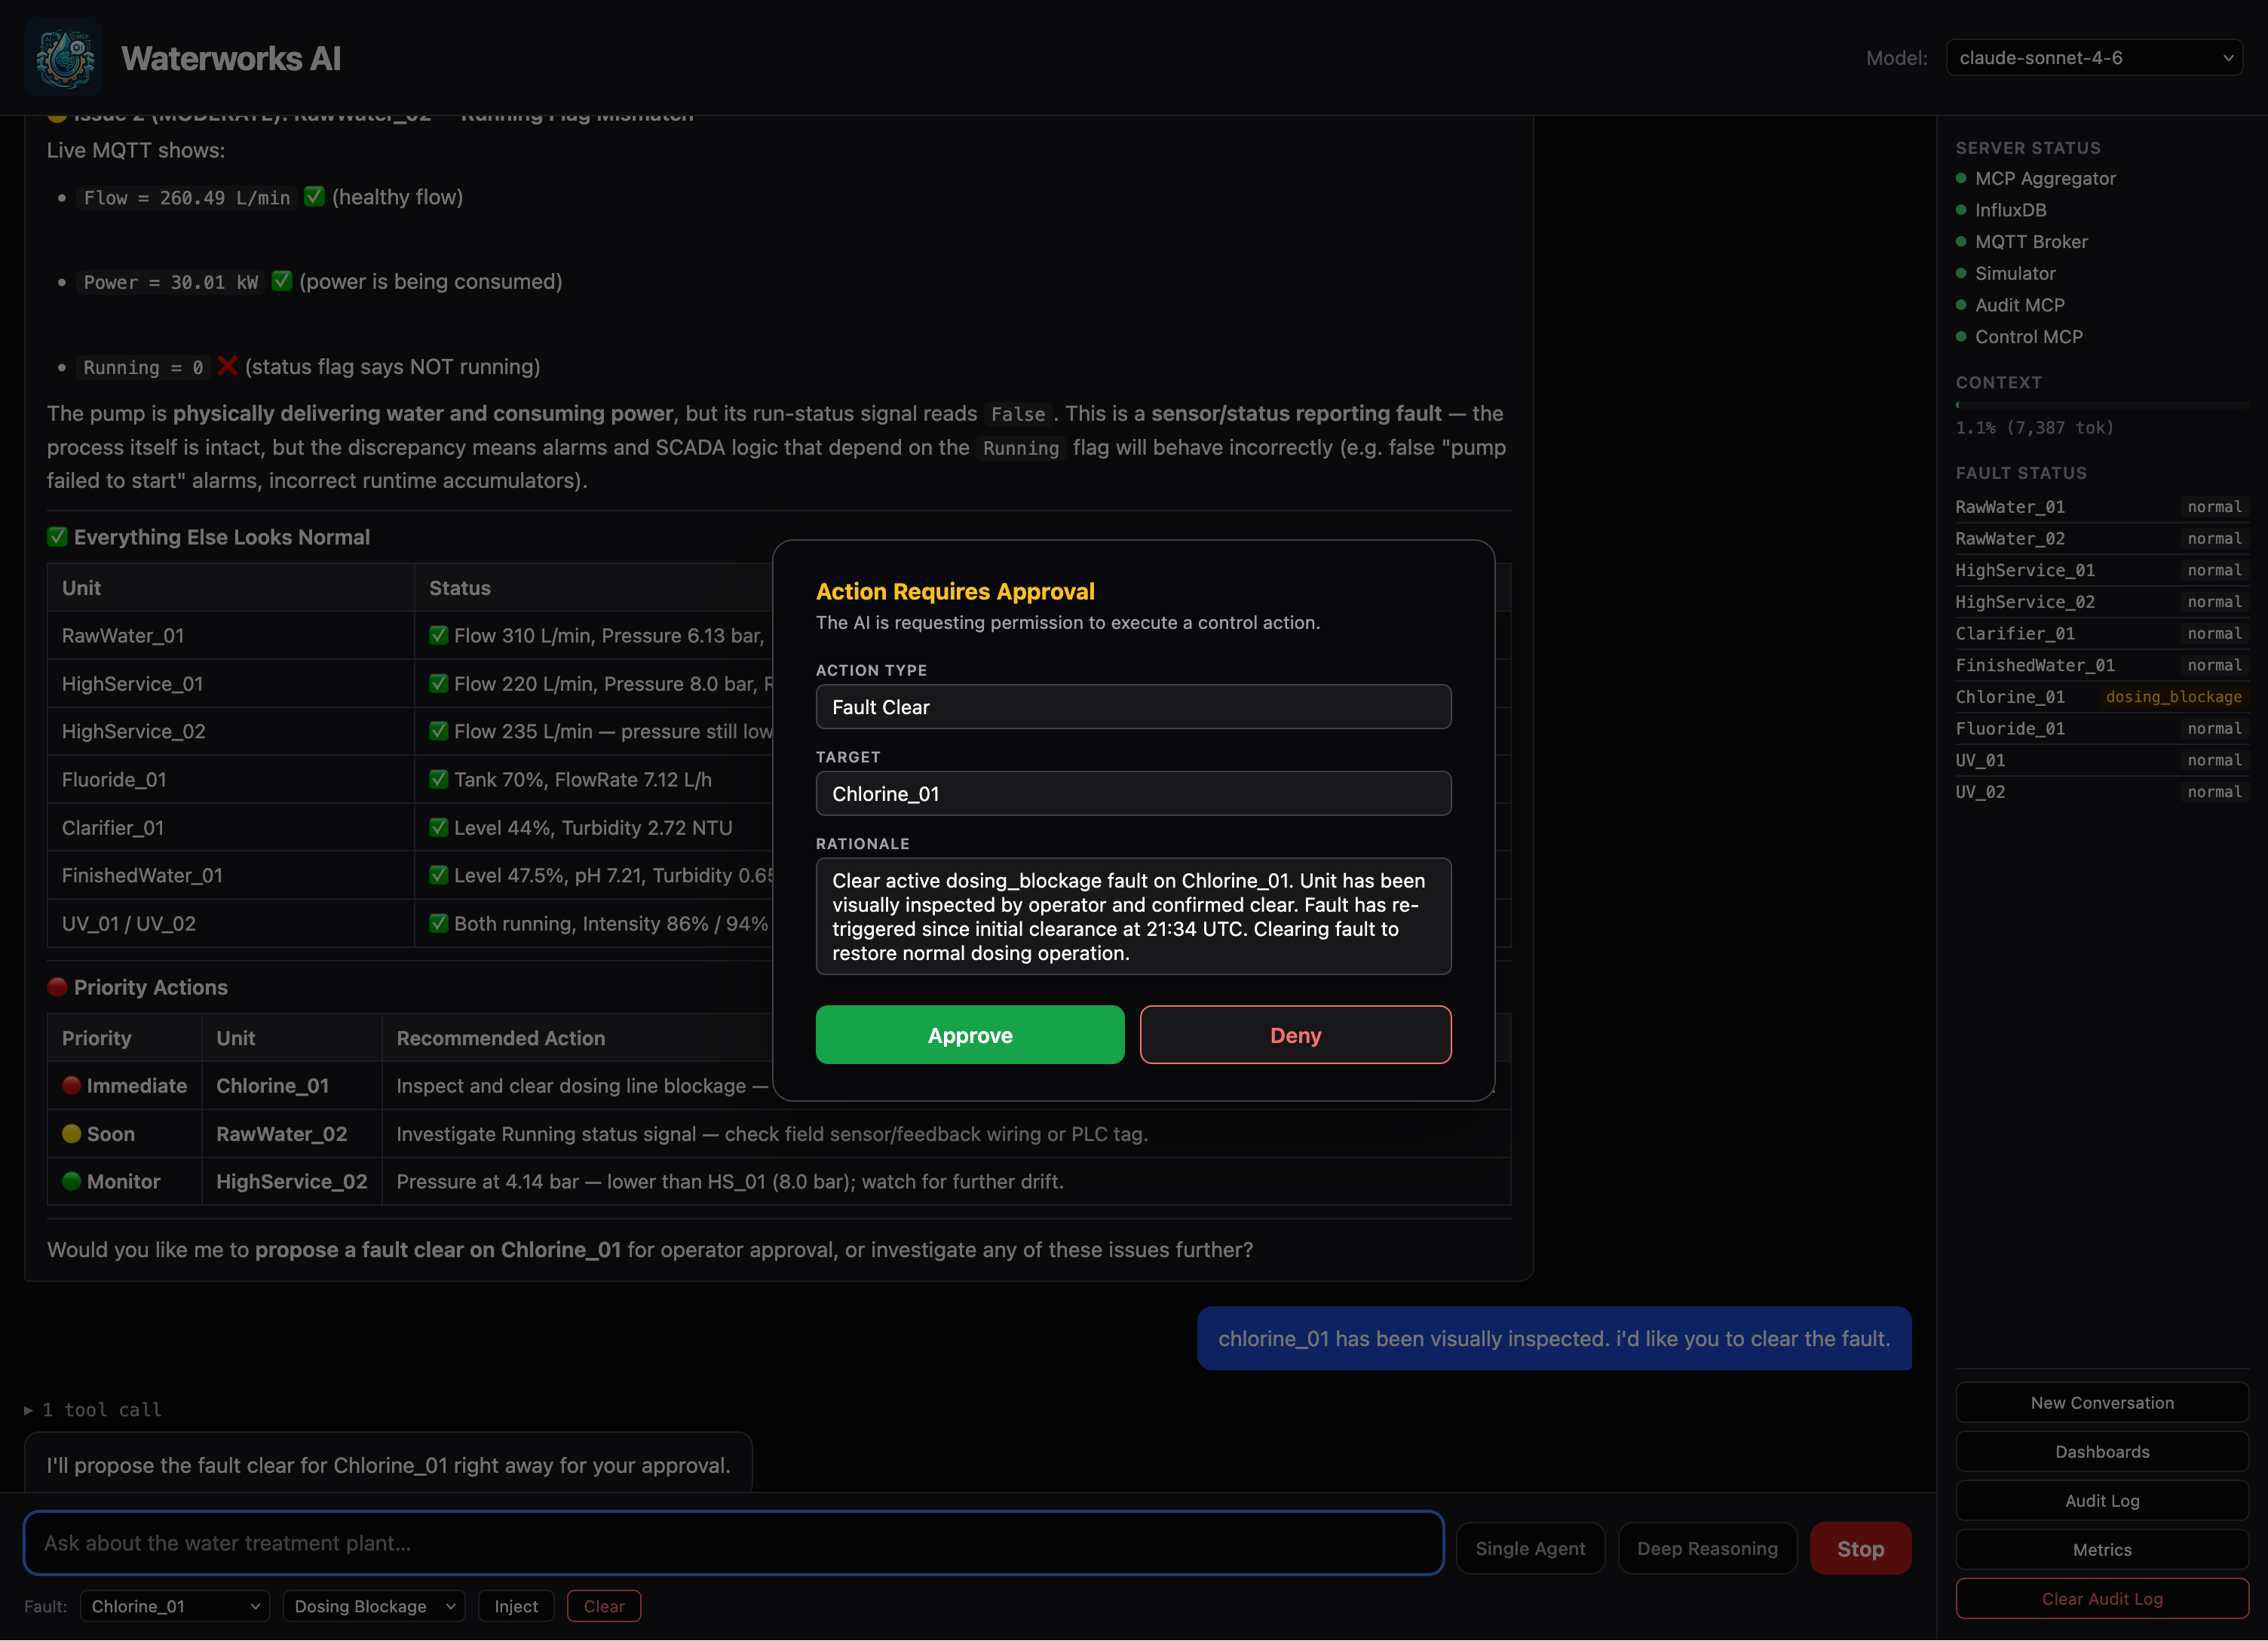 Agent validates a bearing wear finding on RawWater_P01 as actionable. Before executing the setpoint write, the operator is prompted to approve or deny.
How it works
Browser Chat UI
    │
    ▼
Claude API or Ollama
    │
    ▼
MCP Aggregator  :8100
    ├── mqtt-mcp      :8001 ──► Mosquitto MQTT broker  :1883
    ├── opcua-mcp     :8002 ──► OPC-UA server (in simulator)
    ├── influxdb-mcp  :8003 ──► InfluxDB  :8086
    ├── audit-mcp     :8004 ──► metrics.db  (session_summaries, action_events)
    ├── control-mcp   :8005 ──► Simulator  :8090  (/fault, /setpoint)
    └── memory-mcp    :8006 ──► LadybugDB (graph) + DuckDB (analytical)
                                    │       + data/specialist-memory/ (per-agent files)
                                    ▲
Simulator ──────────────────────────┤  publishes to MQTT + OPC-UA simultaneously
                                    │
MQTT → InfluxDB bridge ─────────────┘  subscribes Plant/WTP/# → writes wtp_process
  Chat backend also writes ai_metrics to InfluxDB per turn
The simulator runs a configurable fault injection engine. Inject a fault mid-session and ask the AI to diagnose it. It reads live values, correlates anomalies across instruments and explains what it sees. If a corrective action is warranted, it proposes one through the operator approval gate before making any change.
Prerequisites
- Docker Desktop — runs Mosquitto, InfluxDB, and Grafana
- Git with submodule support —
git clone --recurse-submodulesis required - Python 3.11+ — all components are pure Python
- uv — fast Python package manager (
brew install uvorpip install uv) - Anthropic API key — or a local Ollama installation
Quick start
git clone --recurse-submodules https://github.com/smslavin/waterworks-ai
cd waterworks-ai
cp .env.example .env
# edit .env: set ANTHROPIC_API_KEY

# Optional but recommended: enable audit log encryption
# Generate a 32-byte key and add it to .env as AUDIT_KEY:
python3 -c "import os, base64; print('AUDIT_KEY=' + base64.b64encode(os.urandom(32)).decode())" >> .env
Each component gets its own virtualenv. Run this once to create and populate all of them:
(cd simulator              && uv venv && uv pip install -r requirements.txt)
(cd mcp-servers/mqtt-mcp  && uv venv && uv pip install -r requirements.txt)
(cd mcp-servers/opcua-mcp && uv venv && uv pip install -r requirements.txt)
(cd influxdb-mcp           && uv venv && uv pip install -r requirements.txt)
(cd audit-mcp              && uv venv && uv pip install -r requirements.txt)
(cd control-mcp            && uv venv && uv pip install -r requirements.txt)
(cd memory-mcp             && uv venv && uv pip install -r requirements.txt)
(cd mcp-aggregator/server  && uv venv && uv pip install -r requirements.txt)
(cd chat-ui                && uv venv && uv pip install -r requirements.txt)
(cd mqtt-influx-bridge     && uv venv && uv pip install -r requirements.txt)
Then open eleven terminals (or a terminal multiplexer) and run each in order:
# 1 — Infrastructure
docker compose up -d

# 2 — Simulator  (MQTT + OPC-UA, fault/setpoint control on :8090)
cd simulator && .venv/bin/python simulator.py

# 3 — MQTT MCP server
cd mcp-servers/mqtt-mcp && FASTMCP_PORT=8001 .venv/bin/python server.py

# 4 — OPC-UA MCP server
cd mcp-servers/opcua-mcp && FASTMCP_PORT=8002 .venv/bin/python server.py

# 5 — InfluxDB MCP server
cd influxdb-mcp && .venv/bin/python server.py

# 6 — Audit MCP server
cd audit-mcp && .venv/bin/python server.py

# 7 — Control MCP server
cd control-mcp && .venv/bin/python server.py

# 8 — Memory MCP server  (LadybugDB + DuckDB + specialist memory, seeds DB on first run)
cd memory-mcp && .venv/bin/python server.py

# 9 — MCP Aggregator  (our backends.json, upstream server code)
cd mcp-aggregator/server && BACKENDS_FILE=../backends.json .venv/bin/python server.py

# 10 — MQTT → InfluxDB bridge
cd mqtt-influx-bridge && .venv/bin/python bridge.py

# 11 — Chat UI
cd chat-ui && .venv/bin/python backend.py
Open http://localhost:8080 in a browser.
Open dashboard.html in a browser for an architecture overview and quick-start prompts.
Windows quick start
The quick start above uses bash syntax. PowerShell equivalents follow. Clone and .env setup are identical.
Create virtualenvs — run from the repo root in PowerShell:
foreach ($dir in @("simulator", "mcp-servers/mqtt-mcp", "mcp-servers/opcua-mcp", "influxdb-mcp", "audit-mcp", "control-mcp", "memory-mcp", "mcp-aggregator/server", "chat-ui", "mqtt-influx-bridge")) {
    Push-Location $dir; uv venv; uv pip install -r requirements.txt; Pop-Location
}
Start services — open eleven PowerShell terminals and run each in order:
# 1 — Infrastructure
docker compose up -d

# 2 — Simulator
cd simulator; .venv\Scripts\python simulator.py

# 3 — MQTT MCP server
cd mcp-servers\mqtt-mcp; $env:FASTMCP_PORT = "8001"; .venv\Scripts\python server.py

# 4 — OPC-UA MCP server
cd mcp-servers\opcua-mcp; $env:FASTMCP_PORT = "8002"; .venv\Scripts\python server.py

# 5 — InfluxDB MCP server
cd influxdb-mcp; .venv\Scripts\python server.py

# 6 — Audit MCP server
cd audit-mcp; .venv\Scripts\python server.py

# 7 — Control MCP server
cd control-mcp; .venv\Scripts\python server.py

# 8 — Memory MCP server
cd memory-mcp; .venv\Scripts\python server.py

# 9 — MCP Aggregator
cd mcp-aggregator\server; $env:BACKENDS_FILE = "..\backends.json"; .venv\Scripts\python server.py

# 10 — MQTT → InfluxDB bridge
cd mqtt-influx-bridge; .venv\Scripts\python bridge.py

# 11 — Chat UI
cd chat-ui; .venv\Scripts\python backend.py
The curl commands in the fault injection section work as-is in PowerShell 7+ and Windows 10+. If curl resolves to Invoke-WebRequest instead, use curl.exe explicitly.
Running as Windows services (server deployments)
For a Windows Server VM, use NSSM to run each component as a Windows service instead of keeping terminals open. After creating venvs and configuring .env:
# Run as Administrator
.\windows\install-services.ps1
This installs all ten components as auto-start Windows services with timestamped log rotation to C:\logs\waterworks\. Ports are pre-offset to coexist with graccess-mcp on the same host — adjust the port variables at the top of the script if running standalone.
The script shares an existing MQTT broker rather than running a second Mosquitto instance. If no broker is running, install Mosquitto for Windows first — it installs as a Windows service automatically. InfluxDB and Grafana must also be installed natively (links in the script header). After the first manual start sequence (printed by the script), all services restart automatically at boot and on failure.
To remove: .\windows\uninstall-services.ps1
Process units
The simulator models a municipal water treatment plant.
| Type | Instance | Attributes |
|---|---|---|
| Pump | RawWater_01, RawWater_02 | Flow (L/min), Pressure (bar), Power (kW), Running |
| Pump | HighService_01, HighService_02 | Flow (L/min), Pressure (bar), Power (kW), Running |
| Clarifier | Clarifier_01 | Level (%), Turbidity (NTU) |
| StorageTank | FinishedWater_01 | Level (%), Turbidity (NTU), pH |
| Dosing | Chlorine_01, Fluoride_01 | FlowRate (L/h), Running, TankLevel (%) |
| UV | UV_01, UV_02 | Intensity (%), Running, LampHours |
MQTT topic pattern: Plant/WTP/<Type>/<Instance>/<Attribute>
OPC-UA path pattern: Objects/Plant/WTP/<Type>/<Instance>/<Attribute>
Fault injection
Faults are applied per-instance at runtime without restarting the simulator. The chat UI has an injection panel in the input area. You can also use the HTTP control plane directly:
# Inject a fault
curl -X POST "http://localhost:8090/fault?target=RawWater_01&mode=suction_starvation"

# Clear it
curl -X POST "http://localhost:8090/fault?target=RawWater_01&mode=normal"

# Check all instances
curl http://localhost:8090/status
Fault modes are equipment-specific. The injection panel only shows modes valid for the selected instance.
Pump (RawWater_01, RawWater_02, HighService_01, HighService_02)
| Mode | What it simulates |
|---|---|
suction_starvation | Supply cut to a running pump. Flow ramps toward zero over ~50 s; pressure becomes erratic. Running stays True. |
run_status_fault | Feedback bit stuck True while pump is actually off. Flow and Power read near zero. |
pressure_drift | Transmitter calibration drift. Reported pressure diverges progressively from true value. |
cavitation | Intermittent vapor formation. Flow collapses unpredictably; pressure spikes and dips rapidly. |
Clarifier (Clarifier_01)
| Mode | What it simulates |
|---|---|
level_sensor_fault | Level transmitter noise. Reported level oscillates ±20% around true value. |
turbidity_spike | Sedimentation failure or upstream contamination. Turbidity climbs above 4 NTU. |
StorageTank (FinishedWater_01)
| Mode | What it simulates |
|---|---|
level_sensor_fault | Level transmitter noise. Reported level oscillates ±20% around true value. |
turbidity_spike | Treatment failure or contamination. Finished water turbidity above 1 NTU. |
Dosing (Chlorine_01, Fluoride_01)
| Mode | What it simulates |
|---|---|
dosing_blockage | Discharge line obstruction. FlowRate ramps to zero over ~50 s. Running stays True. |
tank_empty | Chemical supply exhausted. TankLevel depletes to zero over ~130 s. |
run_status_fault | Feedback bit stuck True while pump is actually off. FlowRate reads near zero. |
UV (UV_01, UV_02)
| Mode | What it simulates |
|---|---|
lamp_degradation | Progressive UV lamp aging. Intensity ramps down to ~20% over ~120 s. |
lamp_failure | Sudden lamp failure. Intensity drops to near zero immediately. |
Audit and control
Beyond read-only diagnostics, the stack includes a compliance-grade audit trail and an operator-gated control layer.
Session summaries
Every completed session — single-agent and multi-agent — writes a session_summary record containing the user question, equipment touched, the AI's diagnosis, overall status (Normal / Anomaly Detected / Fault Detected), and a confidence score. Action events (proposals and operator decisions) are linked to the session by ID.
These records are queryable by the AI itself in subsequent sessions. Ask "what happened yesterday at 2am?" and it reads the audit trail to narrate the incident rather than re-reading raw sensor data.
Audit MCP tools
audit-mcp exposes four tools through the aggregator:
| Tool | Purpose |
|---|---|
list_incidents(date, hours_back) | Fault and anomaly sessions in a date window |
get_session_summary(session_id) | Full record: diagnosis, confidence, actions, decisions |
query_by_equipment(equipment_id, hours_back) | All sessions touching a specific unit |
query_history(start, end, equipment) | Narrative-ready correlated records for a time range |
query_history returns records pre-correlated in causal order: fault detected → diagnosis → action proposed → operator decision → outcome. The AI receives the structure and synthesizes the narrative — it does not need additional tool calls to tell the story.
Encrypted audit log
chat-ui/audit.jsonl is encrypted at rest (AES-256-GCM, one random nonce per record) and tamper-evident (SHA-256 hash chain — each record commits to a hash of the previous encoded line). Any modification to a past record breaks the chain.
Set up encryption:
# Generate a key and add it to .env
python3 -c "import os, base64; print('AUDIT_KEY=' + base64.b64encode(os.urandom(32)).decode())" >> .env
Without AUDIT_KEY set the log falls back to unencrypted plaintext with a startup warning — suitable for local development, not production.
Verify chain integrity:
AUDIT_KEY=<your-key> python3 chat-ui/audit_verify.py chat-ui/audit.jsonl
# verbose: shows every record with ✓
AUDIT_KEY=<your-key> python3 chat-ui/audit_verify.py --verbose chat-ui/audit.jsonl
Export / SIEM import:
The /api/audit/download endpoint serves the raw encrypted file. Import it into your SIEM or compliance tool with the key; the encrypted blobs are what give the chain its integrity — do not decrypt before import. To decrypt locally for forensic review:
AUDIT_KEY=<your-key> python3 chat-ui/audit_verify.py --decrypt chat-ui/audit.jsonl > audit_plaintext.jsonl
Log rotation:
The "Clear Audit Log" button calls /api/audit/clear, which archives the current file to audit.YYYYMMDDTHHMMSSZ.jsonl and starts a fresh chain. Archives are retained alongside the live log. On Linux you can apply OS-level append protection after each rotation:
sudo chattr +a chat-ui/audit.jsonl
Control actions and operator approval
control-mcp exposes three tools:
| Tool | Purpose |
|---|---|
propose_action(description, action_type, target, value) | Request operator approval before any change |
set_setpoint(target, attribute, value) | Write a new setpoint to the simulator |
clear_fault(target) | Restore a unit to normal operation |
When the AI calls propose_action, the backend intercepts it before it reaches the MCP server. The SSE stream pauses, an approval dialog appears in the UI with the action details and rationale, and the stream blocks until the operator decides. Approval unblocks the stream and the AI proceeds with the execution tool. Denial returns a denial message to the AI, which acknowledges it and does not proceed.
Both outcomes are recorded in action_events with equal fidelity. "AI proposed increasing chlorine setpoint, operator denied" is compliance-relevant data. Denials are not second-class events.
Setpoint ramping
Setpoint changes use a first-order lag rather than an instantaneous clamp. Each simulator tick moves the published value 10% of the remaining distance toward the target. The value approaches exponentially and snaps when within 0.01 units. This matches physical process behavior where actuators don't jump instantly to a new setpoint.
Demo sequence
Basic diagnostic demo
- Start all services and open http://localhost:8080
- Ask: "Give me a health overview of the plant" — establishes baseline
- Inject:
RawWater_01 → suction_starvation - Ask: "There seems to be an issue. Can you tell what is happening?"
- Watch the AI cross-reference live values, pull historical data from InfluxDB, and diagnose without being told where the fault is
- Open http://localhost:3000 — fault annotation visible on both dashboards
- Clear the fault, ask the AI to confirm recovery
Audit and control demo
- Continue from the basic demo (or inject a new fault)
- Ask the AI to diagnose and propose a corrective action
- The approval dialog appears — review the rationale, approve or deny
- If approved: the AI calls
set_setpointorclear_fault; the value ramps toward the new target - Ask the AI to confirm the change took effect by reading live sensor data
- Start a new session and ask: "What happened in the last hour?"
- The AI uses audit tools to narrate the incident, diagnosis, and operator decision from the session record
Agent memory demo
Requires at least two diagnostic sessions with a non-normal finding to demonstrate cross-session recall.
- Complete the basic diagnostic demo — the session ends with a fault detected, confidence ≥ 0.7
- After the session, inspect what was stored:
data/specialist-memory/intake.md— specialist's timestamped key findings- Query LadybugDB:
python -c "import ladybug as lb; db = lb.Database('data/ladybugdb/fieldworks.db', read_only=True); conn = lb.Connection(db); print(list(conn.execute('MATCH (i:Incident) RETURN i.session_id, i.status, i.confidence LIMIT 5').rows_as_dict()))"
- Start a new session on the same area and ask the same question
- The specialist's system prompt now opens with "Accumulated knowledge from prior sessions" — you can observe this as the AI references previous findings without being told about them
- For cross-session pattern detection, ask: "Has RawWater_01 had this kind of problem before?"
- To inspect the full equipment history, ask: "What is the incident history for the intake pumps?" — the AI calls
get_equipment_historywhich queries LadybugDB directly
Historian long-horizon demo
Requires memory-mcp running and at least one DuckDB sync cycle completed (wait up to DUCKDB_SYNC_INTERVAL, default 1 hour after first start, or set DUCKDB_SYNC_INTERVAL=60 for a faster first sync).
- In multi-agent mode, ask: "Is there any correlation between pump pressure drops and turbidity spikes over the last 30 days?"
- The Historian specialist calls
memory__run_correlationwith a cross-equipment SQL query against DuckDB — watch the tool call appear in the browser - The response cites specific days and magnitudes rather than just recent readings
- For fault frequency analysis, ask: "Which unit has had the most faults in the last month?" — Historian queries
wtp_fault_eventsin DuckDB - To confirm Historian is not using stale data for recent readings, ask: "What is the current turbidity?" — the Historian should use InfluxDB, not DuckDB, and note that live readings belong to the area specialists
Dashboards
Grafana is available at http://localhost:3000 (admin / waterworks by default. Change before any network-accessible deployment).
Two dashboards are pre-provisioned:
WTP Process Data — plant health KPIs, flow/pressure/quality trends, fault and AI query annotations.
AI Metrics — covers both single-agent and multi-agent sessions.
| Panel | What it shows |
|---|---|
| Questions Answered | One count per user question in both modes |
| Avg Response Latency | End-to-end latency from the user's perspective |
| Total Tool Calls | All tool calls across all agents |
| Errors | Error count across all agents |
| Est. Cost | Model-aware: Haiku $0.80/$4, Sonnet $3/$15, Opus $15/$75 per 1M in/out tokens |
| AI Activity During Faults | Tool calls and response latency over time, with fault annotations |
| Token Usage per Turn | Per-turn tokens, labeled by agent role |
| Tool Calls per Turn | Per-turn tool calls, same role grouping |
| Specialist Latency | Latency per specialist call — shows orchestrator vs. each specialist |
| Specialist Confidence | Diagnostic confidence (0–1) per specialist per session |
| Specialist Diagnostic Status | Color-coded Normal / Anomaly / Fault strip per specialist |
The bottom three panels are only populated in multi-agent mode. Fault annotations appear on both dashboards at the same timestamps.
InfluxDB UI is at http://localhost:8086.
Context management
The chat backend actively manages the Claude API context window across a session.
Prompt caching — the system prompt and tool definitions are marked with cache_control: ephemeral. After the first API call in a session, both are served from Anthropic's prompt cache. On multi-turn sessions with many tool calls this reduces input token cost by 80–90% and cuts time-to-first-token noticeably.
Token budget warnings — when context usage crosses 70% of the context window, a [System: ...] instruction prepends the next tool result asking the model to be concise. At 85% it instructs the model to summarize and stop calling tools. Each threshold fires once per session.
Dynamic system prompt — on the first turn of a new session, the backend fetches two context blocks in parallel before the first API call. Process topology is loaded from MQTT (get_full_topic_tree) and injected as a compact grouped running-state summary (e.g. Pumps: Running: RawWater_01, RawWater_02 | Stopped: HighService_01). Fault history is loaded from InfluxDB (wtp_fault_events, last 10 events) and appended below. Both are cached — process state for 60 seconds, fault history per session. This eliminates the first-turn tool calls that would otherwise discover plant topology, reducing latency noticeably on the opening query.
Context pressure metric — context_pressure (a 0–1 ratio of input_tokens / CONTEXT_WINDOW_TOKENS) is written to InfluxDB and SQLite per turn. The sidebar shows a color-coded bar: green below 70%, amber at 70–85%, red above 85%.
Tool selection guidance — the system prompt instructs the model to use get_full_topic_tree() for broad queries and read_topic_value() only for targeted single-attribute reads. Without this, a full plant snapshot costs 34 sequential tool calls. With it, typically 1–3.
Multi-agent diagnostic mode
The chat UI has a Single Agent / Multi Agent toggle. In multi-agent mode a query fans out to four specialist Haiku agents running in parallel, then a Sonnet orchestrator synthesizes their findings.
User query
    │
    ▼
Orchestrator (Sonnet — control tools)
    │
    ├── Intake specialist       (Haiku — mqtt + influxdb)
    │     RawWater_01, RawWater_02
    │
    ├── Treatment specialist    (Haiku — mqtt + influxdb)
    │     Clarifier_01, UV_01/02, Chlorine_01, Fluoride_01
    │
    ├── Distribution specialist (Haiku — mqtt + influxdb)
    │     HighService_01/02, FinishedWater_01
    │
    └── Historian specialist    (Haiku — influxdb + memory/DuckDB)
          All units, historical trends and long-horizon correlations
All four specialists run simultaneously via asyncio.gather(). Each is scoped to the tool subset relevant to its process area. The orchestrator synthesizes the four findings and, if a clear fault is detected, may propose a control action using the same operator approval flow as single-agent mode.
The UI shows a chip for each specialist. Chips update in real time as events arrive and transition to a color-coded status (Normal / Anomaly Detected / Fault Detected) with a confidence score when each specialist completes.
Multi-agent mode requires a Claude API key. It is incompatible with the Deep Reasoning toggle.
Agent memory
memory-mcp (:8006) gives specialists a four-store memory architecture so knowledge accumulates across sessions.
Stores
| Store | What it holds | Where it lives |
|---|---|---|
| LadybugDB | Knowledge graph — topology, past incidents, observations, operator decision patterns | data/ladybugdb/fieldworks.db |
| DuckDB | Analytical layer — 90-day rolling window synced from InfluxDB for long-horizon correlations | data/duckdb/analytical.duckdb |
| Specialist memory files | Per-specialist markdown — key findings, confidence notes, cross-session anomaly patterns | data/specialist-memory/<name>.md |
| InfluxDB | Raw sensor time series (already running) | InfluxDB :8086 |
All three data/ subdirectories are gitignored and created automatically on first start.
What happens per session
At session start — each specialist's system prompt is prepended with their accumulated memory file, if one exists. A specialist who has seen cavitation on RawWater_01 twice before enters the session knowing it.
At session end — for each non-normal finding:
- An
Incidentnode is written to LadybugDB linked to the equipment instance and the session ID. - If confidence ≥ 0.7, a timestamped entry is appended to the specialist's memory file.
The Historian specialist uses run_correlation against DuckDB for long-horizon analytical queries — "how often has RawWater_01 pressure dropped below 5 bar in the last 90 days?" — without re-reading raw time series through InfluxDB MCP. DuckDB is a materialized copy synced from InfluxDB on a schedule (DUCKDB_SYNC_INTERVAL, default 1 hour); Historian's system prompt directs it to use InfluxDB directly for anything from the last hour. Historian has read-only access to memory tools — write tools are intentionally excluded and handled by the session coordinator.
Graph schema
ladybugdb/schema.cypher defines the full property graph: Facility → ProcessArea → Equipment → EquipmentType → Attribute / FaultMode, with dynamic layers for Incident, Observation, and OperatorDecision. The database is seeded from this file on first start. Run memory-mcp/seed_validation.py to validate the seeding against a temp database before starting the full stack.
Graceful degradation
All three memory calls in multi_agent_loop.py are wrapped in try/except. If memory-mcp is unavailable, diagnostic sessions continue normally — specialists just don't receive prior-session context and incidents are not recorded.
Memory MCP tools
| Tool | Purpose |
|---|---|
get_topology() | Full area → equipment → type tree |
get_specialist_context(area_id) | Structured context for one process area: equipment, attributes, fault modes, tag bindings |
get_equipment_history(equipment_id) | Past incidents, observations, and operator decision patterns for one unit |
get_writable_attributes() | All writable attributes with tag IDs, confirmation requirements, write limits |
query_graph(cypher) | Read-only Cypher escape hatch (write keywords rejected) |
record_incident(...) | Write a diagnostic incident linked to equipment and session |
record_observation(...) | Write a persistent specialist observation |
link_incident_precedes(...) | Create a PRECEDES causality edge between two incidents |
run_correlation(sql) | SELECT against DuckDB analytical layer |
get_specialist_memory(specialist) | Read accumulated markdown memory for a specialist |
append_specialist_memory(specialist, content) | Append a timestamped entry to specialist memory |
Configuration
All configuration lives in .env. Copy .env.example to get started. The defaults work for a local run without changes except for ANTHROPIC_API_KEY.
| Variable | Default | Purpose |
|---|---|---|
ANTHROPIC_API_KEY | (empty) | Required for Claude models |
OLLAMA_URL | http://127.0.0.1:11434 | Ollama base URL |
INFLUXDB_TOKEN | waterworks-dev-token | Set once at first docker compose up |
INFLUXDB_ORG | waterworks | InfluxDB organisation |
INFLUXDB_BUCKET | waterworks | Default bucket for all data |
TOPOLOGY_FILE | (repo root) | Optional path override for topology.yaml |
PUBLISH_INTERVAL | 2.0 | Simulator tick rate in seconds |
OPCUA_PORT | 4840 | OPC-UA server port |
CONTROL_PORT | 8090 | Simulator fault/setpoint control HTTP port |
CONTEXT_WINDOW_TOKENS | 200000 | Context window size for budget warnings |
MEMORY_MCP_PORT | 8006 | memory-mcp SSE port |
LADYBUG_DB_PATH | ../data/ladybugdb/fieldworks.db | LadybugDB database directory |
DUCKDB_PATH | ../data/duckdb/analytical.duckdb | DuckDB file |
SPECIALIST_MEMORY_DIR | ../data/specialist-memory | Per-specialist markdown files |
DUCKDB_SYNC_INTERVAL | 3600 | Seconds between InfluxDB → DuckDB syncs |
AUDIT_KEY | (empty) | Base64-encoded 32-byte AES key for audit log encryption. Unset = plaintext (dev only). |
AUDIT_LOG_PATH | chat-ui/audit.jsonl | Override the audit log file path. |
Note:
INFLUXDB_TOKENand the otherDOCKER_INFLUXDB_INIT_*values are only used on a fresh volume. After the firstdocker compose upthey are baked in. Reset withdocker compose down -v.
Project layout
waterworks-ai/
├── topology.yaml           Plant topology — equipment types, instances, fault modes, process areas
├── ladybugdb/
│   └── schema.cypher       LadybugDB property graph schema + waterworks seed data
├── simulator/              Dual MQTT+OPC-UA WTP simulator with fault injection
│   ├── simulator.py        Entrypoint — asyncio loop, paho MQTT, asyncua, HTTP control plane
│   ├── topology.py         Loader/validator for topology.yaml
│   ├── instances.py        INSTANCES built from topology.yaml at startup
│   ├── generators.py       RandomWalk and OscillatingBool value generators
│   └── faults.py           FaultMode enum, TYPE_FAULT_MODES built from topology, FaultState machine
├── influxdb-mcp/           FastMCP server :8003 — write_point, query, list_measurements
├── audit-mcp/              FastMCP server :8004 — session/action history query tools
├── control-mcp/            FastMCP server :8005 — propose_action, set_setpoint, clear_fault
├── memory-mcp/             FastMCP server :8006 — knowledge graph, analytical, specialist memory
│   ├── server.py           FastMCP entrypoint and tool definitions
│   ├── graph.py            LadybugDB layer — auto-seeds from schema.cypher, read/write tools
│   ├── analytical.py       DuckDB layer — InfluxDB sync loop + correlation queries
│   ├── specialist_mem.py   File-based per-specialist memory (read at start, append at end)
│   ├── requirements.txt
│   └── seed_validation.py  Validates schema seeding against a temp database
├── chat-ui/                Starlette/SSE backend and vanilla JS frontend
│   ├── backend.py          Routes: /api/chat, /api/health, /api/fault, /api/action/respond
│   ├── topology.py         Loader for topology.yaml (chat-ui layer)
│   ├── topology_prompts.py Builds specialist and orchestrator system prompts from topology.yaml
│   ├── claude_loop.py      Claude API streaming loop — MCP tools, propose_action intercept
│   ├── multi_agent_loop.py Fan-out to specialist agents + orchestrator; memory injection + recording
│   ├── openai_loop.py      OpenAI-compatible loop for Ollama
│   ├── mcp_client.py       MCP aggregator client (per-url tool cache, list/call tools)
│   ├── session_store.py    session_summaries + action_events tables in metrics.db
│   ├── control.py          asyncio Future registry for the operator approval flow
│   ├── metrics.py          ai_metrics → InfluxDB + SQLite per turn
│   ├── audit.py            JSONL audit log — AES-256-GCM encrypted, hash-chained, append-only
│   ├── audit_verify.py     CLI: verify chain integrity or decrypt for forensic export
│   ├── providers.json      LLM provider and model configuration
│   └── static/             index.html + app.js (no framework, no bundler)
├── tests/                  Import-level test suite (pytest, no infrastructure required)
├── mqtt-influx-bridge/     Subscribes Plant/WTP/# → writes wtp_process to InfluxDB
├── mcp-servers/            Git submodule — mqtt-mcp (:8001) and opcua-mcp (:8002)
├── mcp-aggregator/
│   ├── server/             Git submodule — aggregator server code (:8100)
│   └── backends.json       Waterworks endpoint config (BACKENDS_FILE=../backends.json)
├── data/                   Gitignored runtime data
│   ├── ladybugdb/          LadybugDB database files (auto-created on first start)
│   ├── duckdb/             DuckDB analytical database (auto-created on first start)
│   └── specialist-memory/  Per-specialist markdown memory files (auto-created on first start)
├── docker/
│   ├── mosquitto/          mosquitto.conf (anonymous, persistence on)
│   └── grafana/            Provisioned InfluxDB datasource and dashboards
├── docker-compose.yml      Mosquitto + InfluxDB 2.7 + Grafana (named volumes)
└── .env.example            All environment variables with defaults
Extending
Add a new process unit: add an entry under instances in topology.yaml. It appears in MQTT, OPC-UA, and the specialist system prompts on next restart — no Python changes required.
Add a new process area: add an entry under process_areas in topology.yaml with an instances list, data_sources, and description. A new specialist agent appears in multi-agent mode on next restart.
Add a new fault mode: add a member to FaultMode in simulator/faults.py, a corresponding _method in FaultState, and an entry under the relevant equipment type's faults in topology.yaml. The HTTP control plane and specialist heuristics pick it up automatically.
Add an MCP server: add an entry to mcp-aggregator/backends.json. The aggregator discovers and prefixes its tools at startup. Use the management API (POST /backends) to add backends at runtime without a restart.
Add a Grafana dashboard: drop a JSON dashboard file into docker/grafana/provisioning/dashboards/ and add a dashboards provisioning YAML alongside it.