
saas-growth-dashboard
SameerKhan/saas-growth-dashboard
Open-source BigQuery-first growth intelligence dashboard for SaaS founders. Connect GA4, ChartMogul, Amplitude, Ahrefs, and 15+ more sources. Includes Claude Code skill for automated CEO reports.
Instalação
npx convez-ai SameerKhan/saas-growth-dashboard1 comando no terminal: detecta o formato do repositório (marketplace ou plugin avulso) e instala via Claude Code. Requer Node 18+ e o Claude Code instalado.
Métricas
README
A tradução para o português deste README ainda está na fila.
📊 SaaS Growth Dashboard
The open-source, BigQuery-first growth intelligence dashboard for SaaS founders
Connect your existing tools via MCP servers, pipe everything into BigQuery, and get a single-page executive dashboard with automated daily reports.
Built and battle-tested at Social Champ, now open-sourced for any SaaS to use.


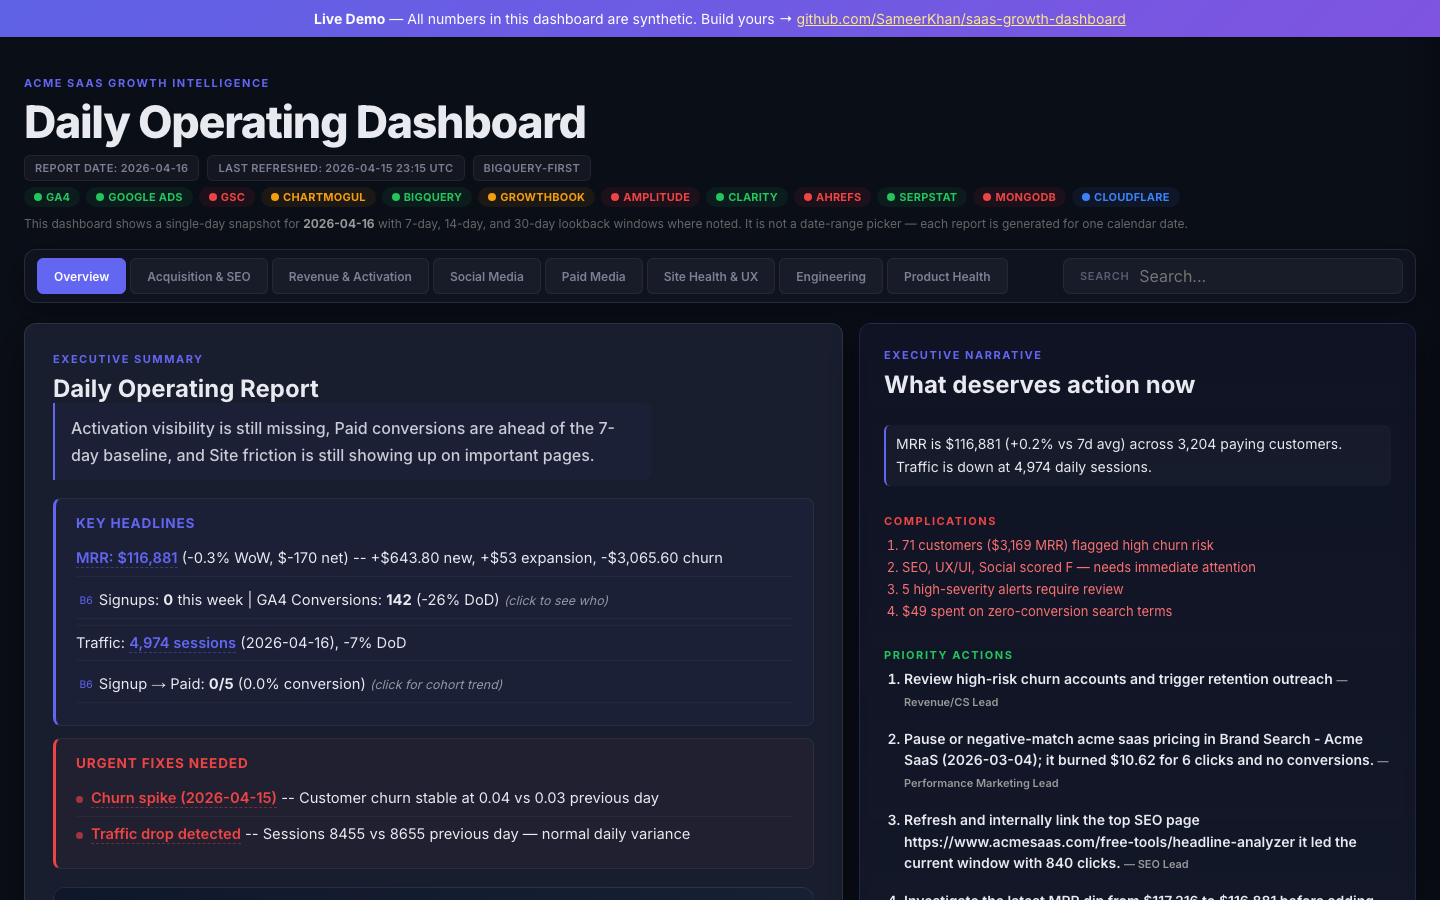
👉 View the fully interactive live demo — all 20 sources connected with synthetic data. Click through every tab.
📖 The Story Behind This
I spent 2 months building something I wish existed 5 years ago.
It started simple. I just wanted to see our Google Analytics and Google Ads data in one place.
Then I connected Amplitude. Then ChartMogul. Then Ahrefs. Then MongoDB, Crisp, ClickUp, GitLab, Meta Ads, Bing Ads, YouTube, Threads, Reddit, Clarity, Lighthouse, GrowthBook, Serpstat...
And before I knew it, I had 20+ data sources feeding into one dashboard.
Here's why I couldn't stop.
Every morning at Social Champ, we opened 8 tabs. GA4 for traffic. ChartMogul for MRR. Amplitude for activation. Ahrefs for SEO. ClickUp for sprint progress. Crisp for support tickets.
Each tool told us one piece. None of them told us the full story.
Which blog post brought the signup that converted to a paying customer? Which paid campaign is burning money on keywords nobody converts on? Which 70% of our blog gets literally zero traffic? How many customers are at churn risk right now?
These questions are impossible to answer when your data lives in 15 different silos.
So I built a single page that answers all of them.
✨ What It Does
🟠 Pulls from 20+ sources via MCP servers and APIs (GA4, ChartMogul, Amplitude, Ahrefs, Clarity, MongoDB, and more)
🟠 Stores everything in BigQuery in a layered warehouse (raw → modeled → executive). Costs $0-5/month for most SaaS
🟠 Generates an interactive HTML dashboard with color-coded KPIs, department health grades (A through F), and prioritized actions
🟠 Works with Claude Code, Codex (ChatGPT), Cursor, or any MCP-compatible tool. You can literally ask "run the daily CEO report" and get a 3-post executive brief
🟠 Connect what you have, skip what you don't. Start with GA4 and one revenue source. Add more as you grow
The best part? Our daily standups went from 20 minutes of "let me pull up the numbers" to opening one page.
💡 Every SaaS founder deserves to know what's actually happening in their business. Not from 8 tabs. Not from a spreadsheet someone fills by hand every Monday. From one place.
🚀 Quick Start (Under 1 Hour)
Prerequisites
- ☁️ Google Cloud project with BigQuery enabled (free tier works)
- 🐍 Python 3.11+
- 🤖 Claude Code, Codex (ChatGPT), Cursor, or any MCP-compatible AI tool (for the AI skill, optional)
- 📊 At least one data source (GA4 recommended as starting point)
Step 1: Clone and configure
git clone https://github.com/SameerKhan/saas-growth-dashboard.git
cd saas-growth-dashboard

# Copy config templates
cp config/config.example.yaml config/config.yaml
cp .env.example .env

# Install dependencies
pip install -r requirements.txt
Step 2: Edit your config
Open config/config.yaml and fill in:
company:
  name: "Your Company"
  domain: "yourcompany.com"

bigquery:
  project_id: "your-gcp-project"

sources:
  ga4:
    enabled: true
    property_id: "123456789"
Add credentials to .env:
BIGQUERY_PROJECT_ID=your-gcp-project
GA4_PROPERTY_ID=123456789
Step 3: Run your first refresh
python run_daily_growth_refresh.py --lookback-days 7
Step 4: Generate the dashboard
python run_growth_dashboard.py --open
Your dashboard opens at reports/growth_dashboard.html. 🎉
Step 5: Install the AI skill (optional)
Works with any MCP-compatible tool. For Claude Code:
cp -r skill/ ~/.claude/skills/saas-growth-intelligence/
For Codex (ChatGPT), Cursor, or other MCP tools, point your MCP config to the same skill directory and connect the MCP servers listed in config/config.yaml.
Now you can say:
- "Run the daily CEO report"
- "Investigate the biggest growth anomaly"
- "Refresh the warehouse"
🏗️ Architecture
                    MCP Servers / APIs
                          │
                    Source Connectors
                    (growth_intelligence/sources/)
                          │
                    BigQuery Warehouse
                    (raw → modeled → executive)
                          │
              ┌───────────┴───────────┐
              │                       │
        HTML Dashboard          AI Skill
        (reports/)      (Claude Code / Codex / Cursor)
              │                       │
         Browser/CDN          Mattermost/Slack
💾 The BigQuery-first principle
Every metric is fetched once, structured once, and reused many times. The warehouse has three layers:
| Layer | Purpose | Example |
|---|---|---|
| Raw | Direct API extracts | raw_ga4_channel_daily |
| Modeled | Joined, deduplicated, business-logic views | daily_growth_kpis |
| Executive | Pre-computed summaries for reporting | ceo_daily_brief |
🔌 Supported Sources (20+)
Connect what you have, skip what you don't. Every source is optional except BigQuery.
🌐 Traffic & Acquisition
| Source | Type | What You Get |
|---|---|---|
| Google Analytics 4 | MCP / API | Sessions, users, channels, landing pages, conversions |
| Google Search Console | API | Organic clicks, impressions, avg position, queries by page |
| Microsoft Clarity | MCP / API | Dead clicks, rage clicks, scroll depth, UX friction scores |
| Lighthouse / PSI | API | Core Web Vitals (LCP, CLS, TBT), performance scores, accessibility |
💰 Revenue & Billing
| Source | Type | What You Get |
|---|---|---|
| ChartMogul | MCP / API | MRR, ARR, churn rate, LTV, ARPA, customer movements (new, expansion, contraction, churn) |
| Stripe | MCP | Subscription validation, billing reconciliation |
🧪 Product & Activation
| Source | Type | What You Get |
|---|---|---|
| Amplitude | MCP / Snapshot | Signup-to-activation funnel, user journeys, feature adoption |
| MongoDB | MCP | NPS feedback, trial conversions, feature depth, job delivery health, payment signals |
| GrowthBook | MCP / Snapshot | A/B test results, experiment lift, confidence levels |
📣 Paid Media
| Source | Type | What You Get |
|---|---|---|
| Google Ads | API | Campaign spend, conversions, CPA, search term intent (brand/competitor/generic) |
| Meta Ads | API | Facebook + Instagram ad performance, reach, CPM, ROAS |
| Bing Ads | API | Microsoft Advertising campaigns, CPC comparison |
🔍 SEO & Content
| Source | Type | What You Get |
|---|---|---|
| Ahrefs | MCP | Domain rating, backlink profile, organic competitors, keyword rankings |
| Serpstat | API | SERP top-100 snapshots, keyword volume, difficulty, CPC |
📱 Social Media & Community
| Source | Type | What You Get |
|---|---|---|
| Meta (Social) | API | Facebook Page reach, Instagram engagement, post performance |
| YouTube | API | Views, watch hours, subscribers, video scorecard, traffic sources |
| Threads | API | Views, likes, replies, reposts, follower growth |
| API (PRAW) | Brand mentions, competitor tracking, opportunity threads |
⚙️ Engineering & Support
| Source | Type | What You Get |
|---|---|---|
| ClickUp | MCP | Sprint health, task completion, bugs, tech debt, roadmap |
| GitLab | API | Merge request pipeline, code velocity, team workload |
| Crisp | API | Support tickets, SLA tracking, resolution time, CSAT |
💡 You don't need all of these. Start with GA4 + one revenue source (ChartMogul or Stripe) and add more as you grow. The dashboard shows "Not Connected" placeholders for missing sources.
📸 Dashboard Tabs
🏠 Overview
Executive narrative with AI-generated daily operating report, department health scores (A–F), and prioritized action items.
Team briefings give each department a one-glance status card with the metrics that matter most to them.
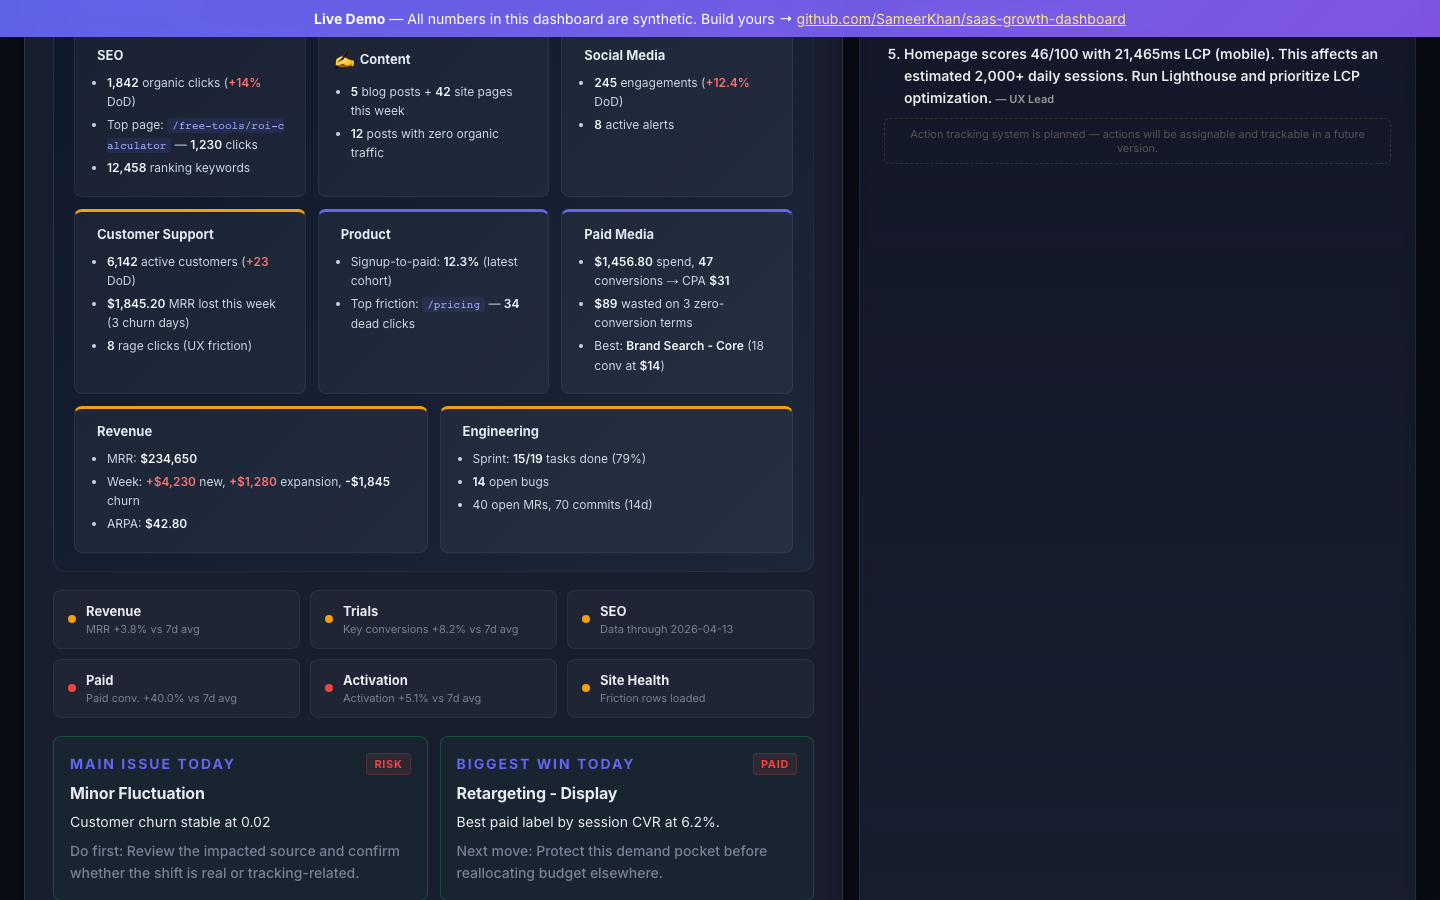
🔍 Acquisition & SEO
Section brief with scored health grade, organic traffic by channel, top landing pages, and keyword rankings from Ahrefs + GSC.
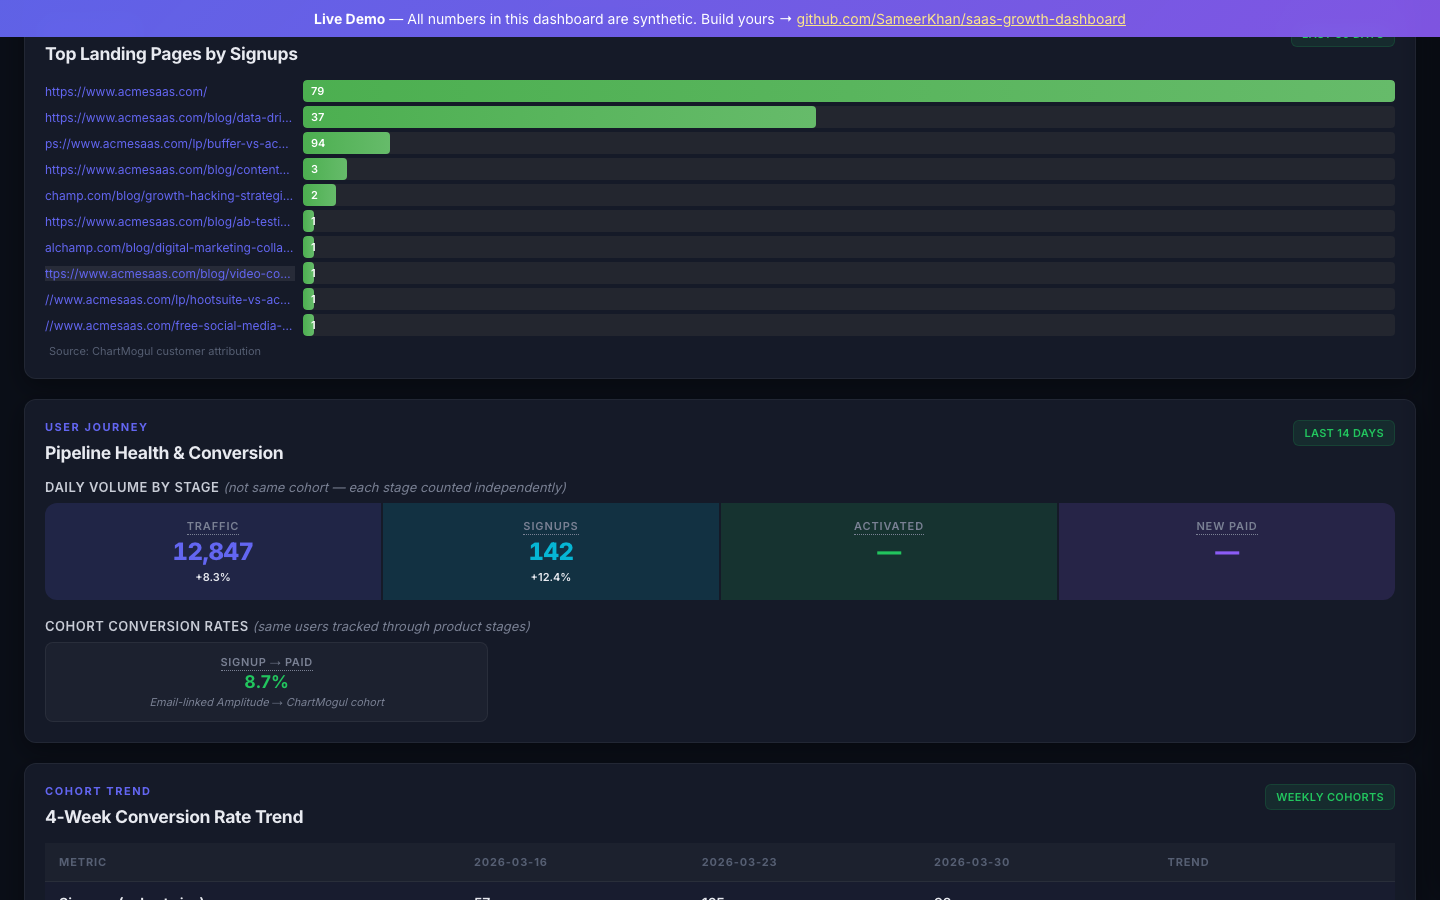
Organic traffic → signup funnel split by stage (BoFU / MoFU / ToFU / Product / Other) with daily conversion tracking.
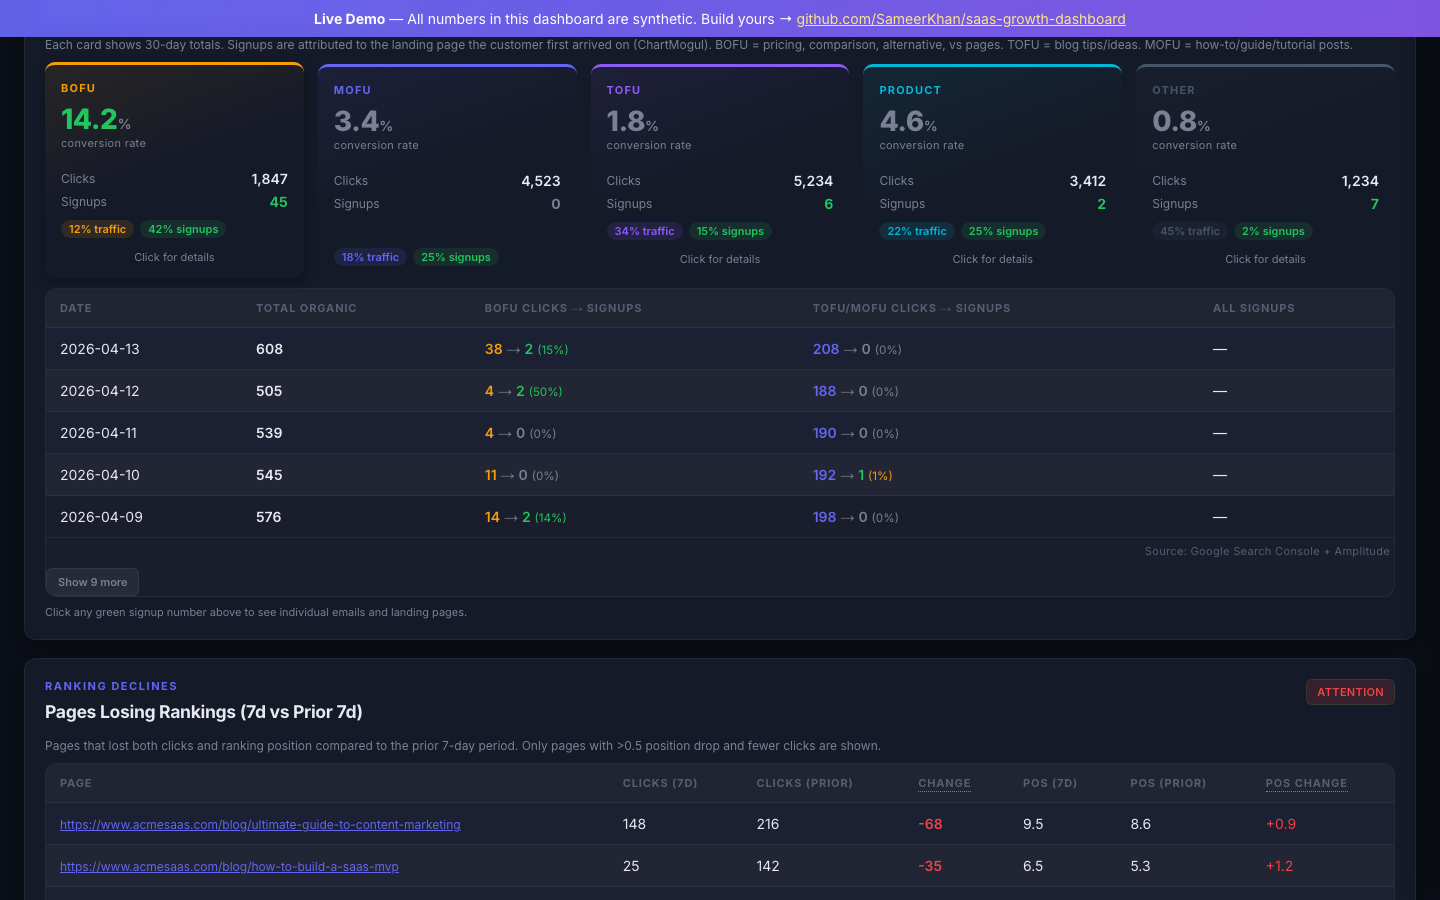
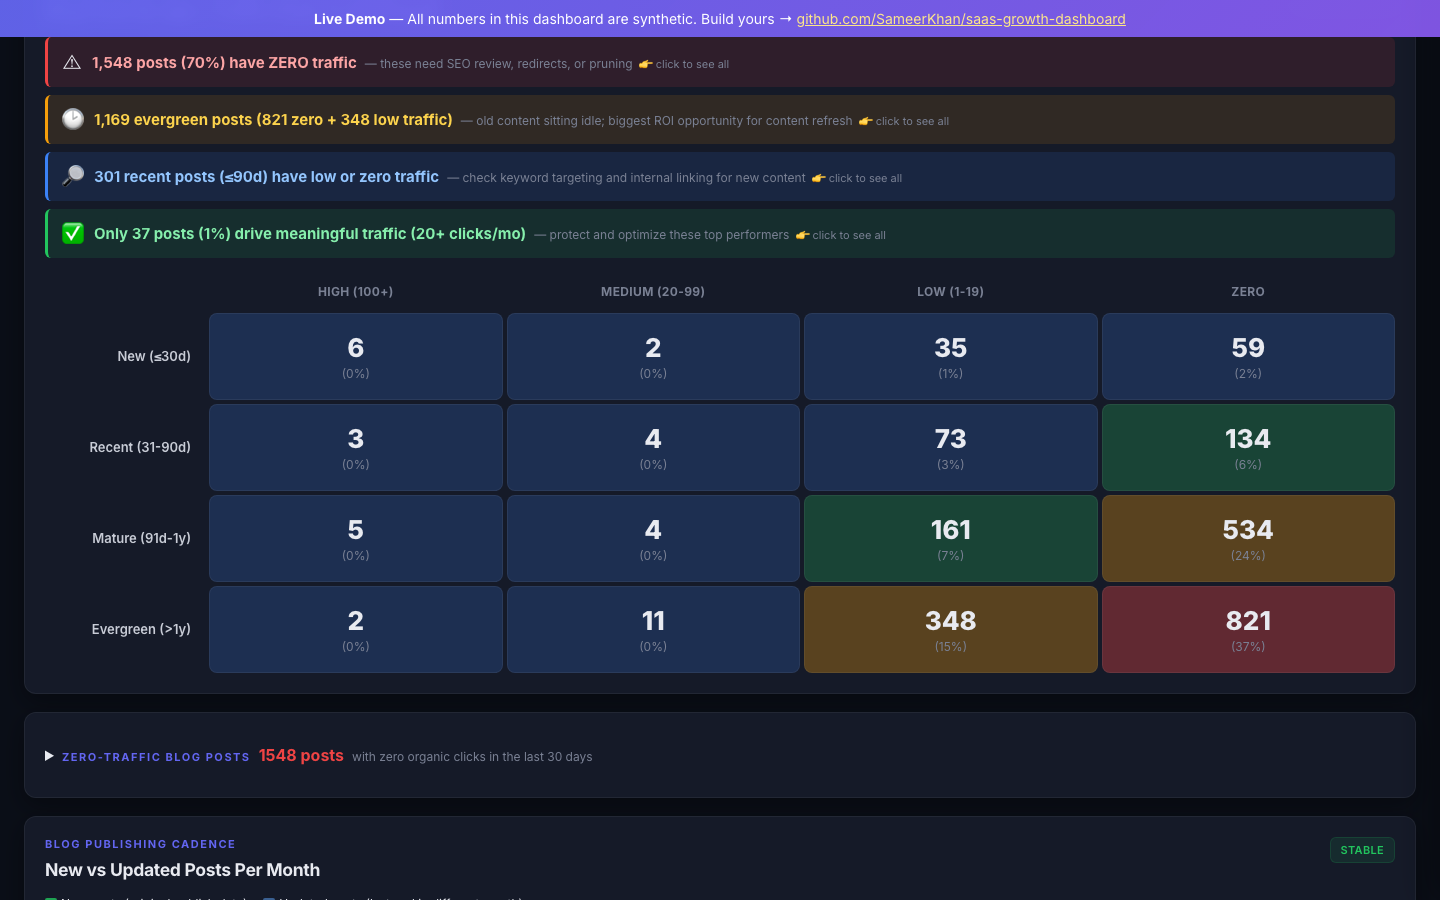
Blog posts by age × traffic matrix. Instantly see which content is driving traffic and which 70% is sitting at zero.
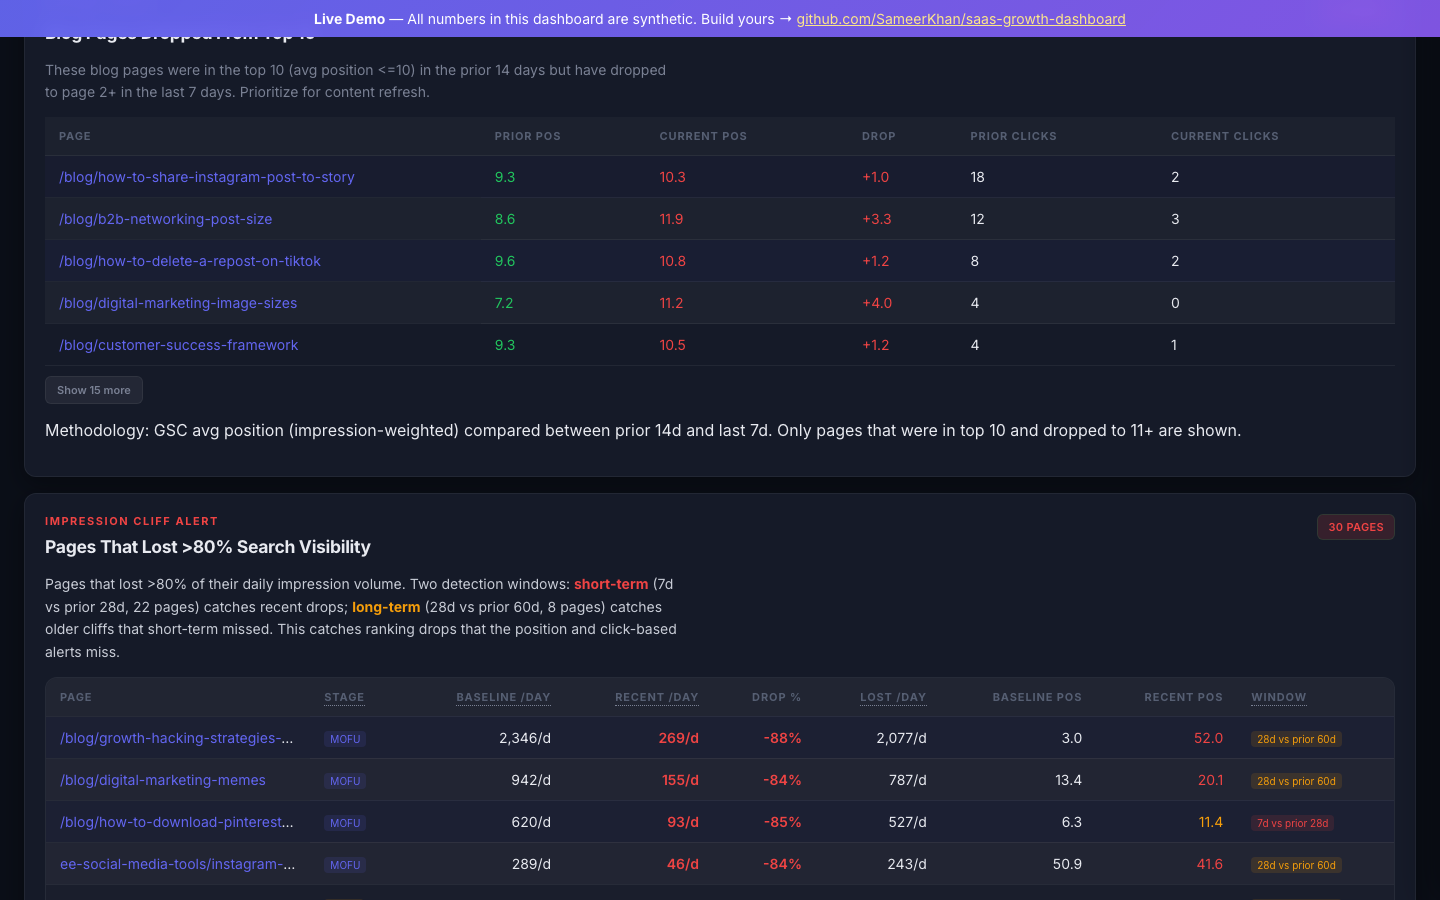
Blog pages dropping out of the top 10, impression cliff alerts with MoFU/BoFU stage tags, and pages that lost >80% search visibility.
💰 Revenue & Activation
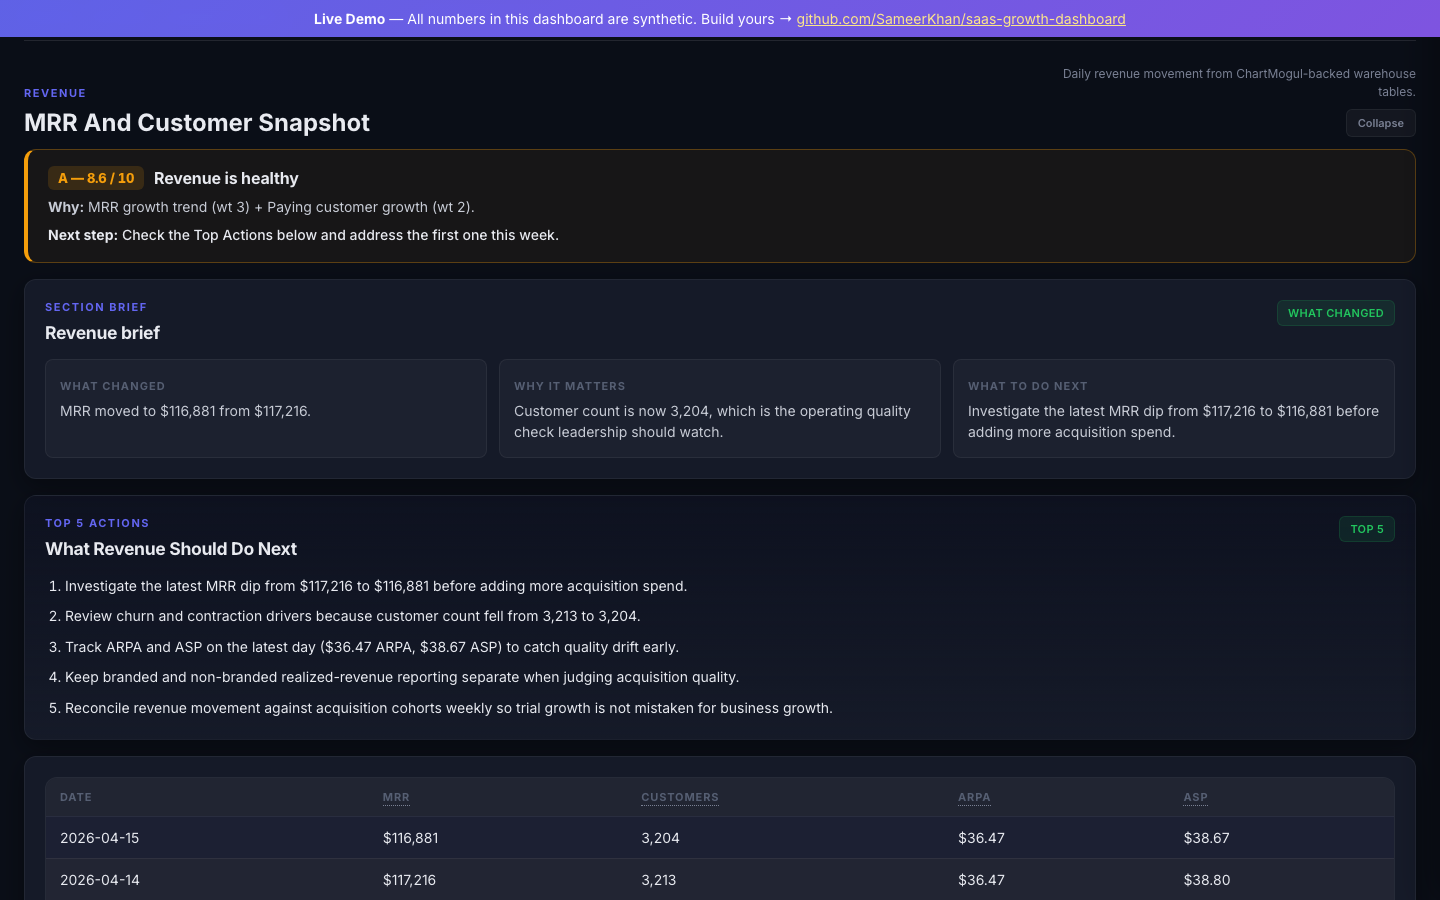
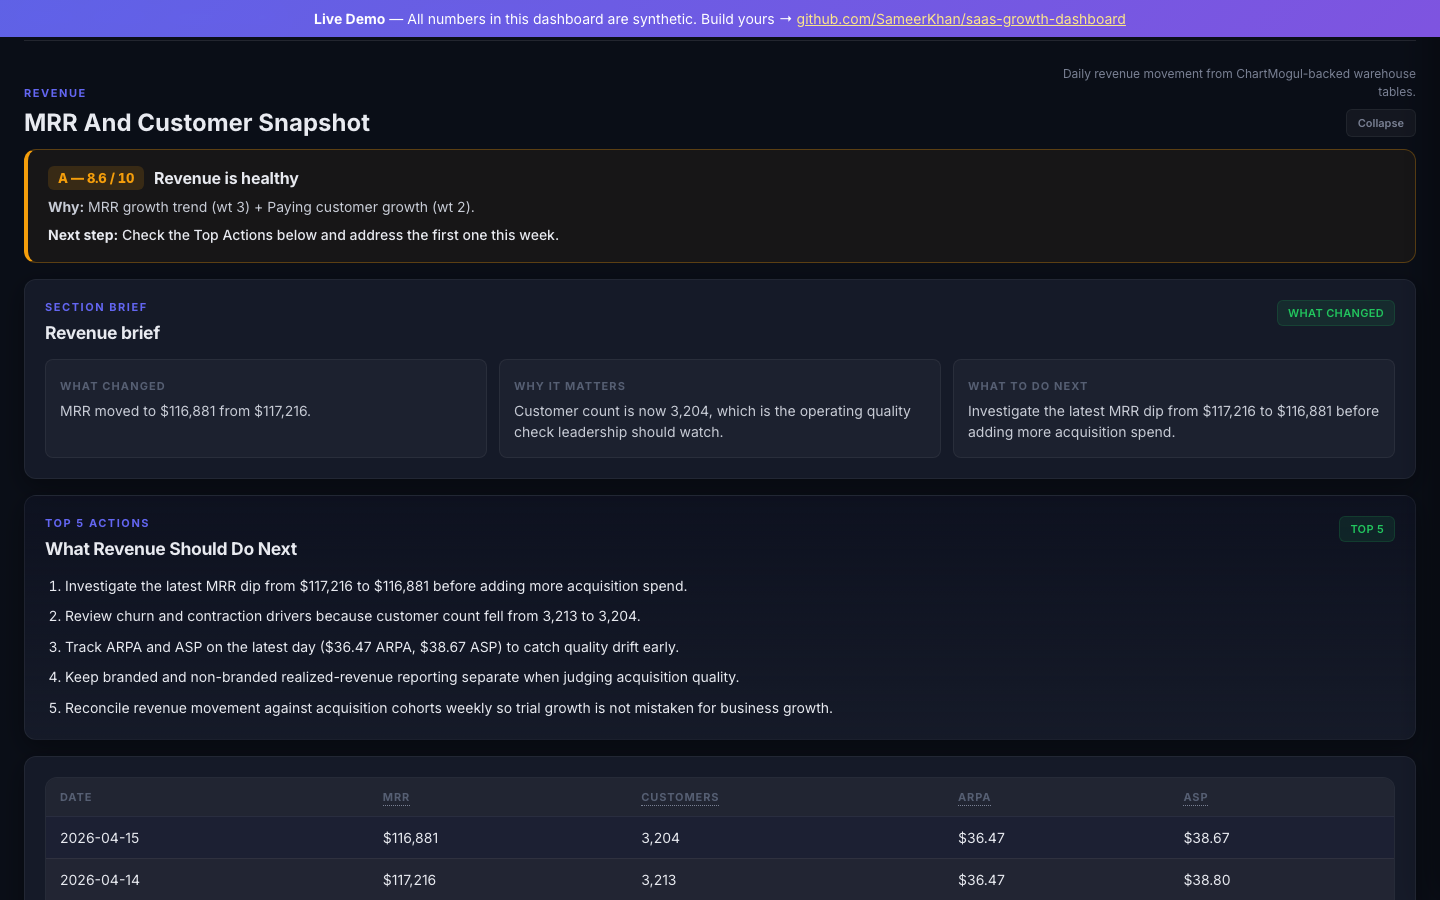
MRR and customer snapshot with health grade, revenue brief (What Changed / Why It Matters / What To Do Next), and ranked action items.
Daily MRR movement strip showing new, expansion, contraction, and churn by day with running totals.
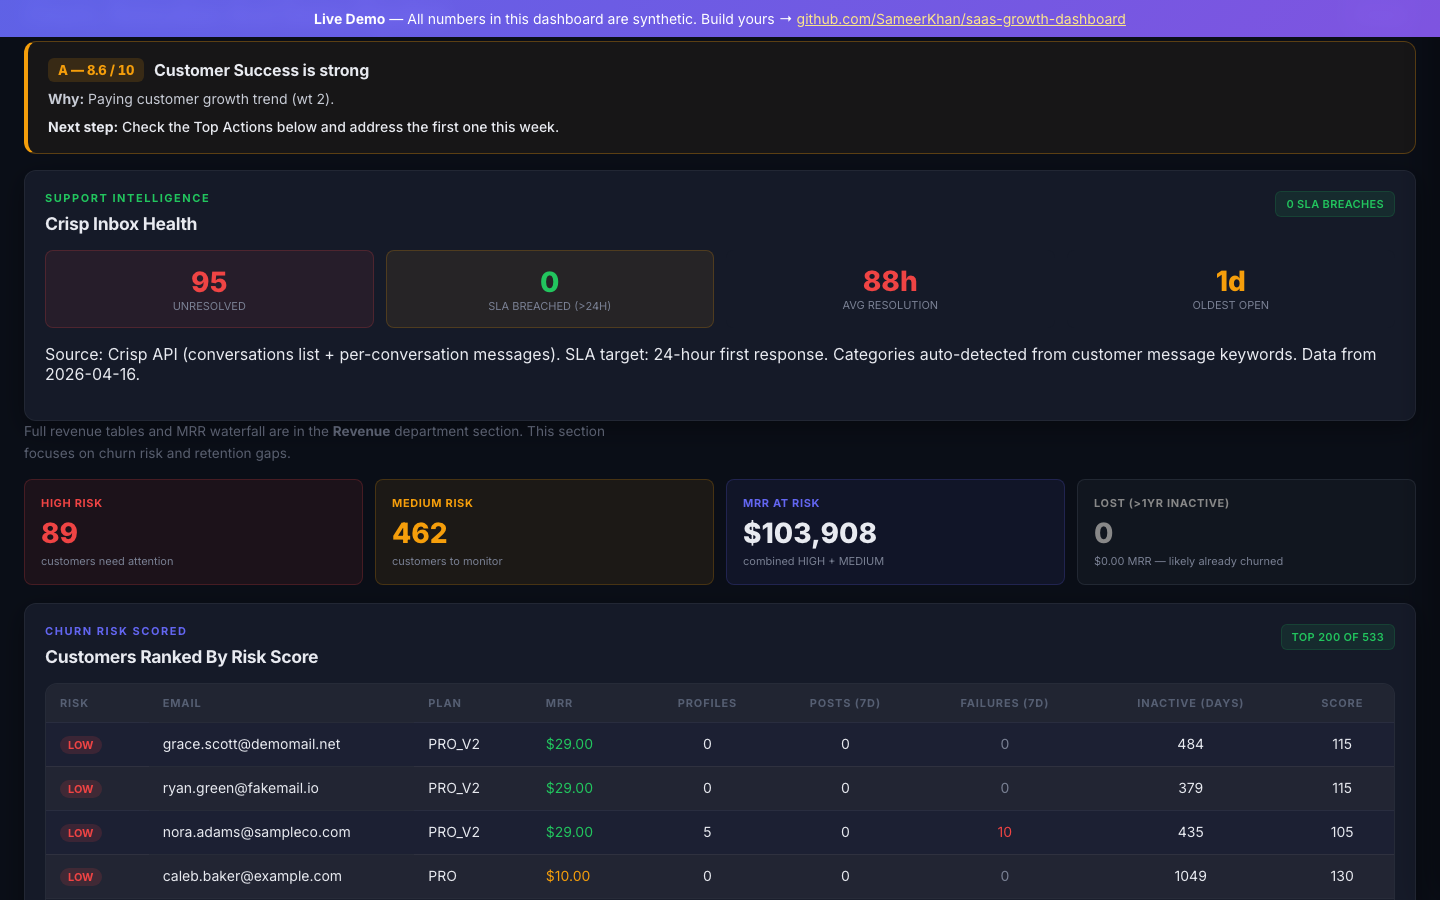
Churn risk scorecard ranking customers by health score, support intelligence with SLA tracking, and MRR at risk breakdown.
📱 Social Media
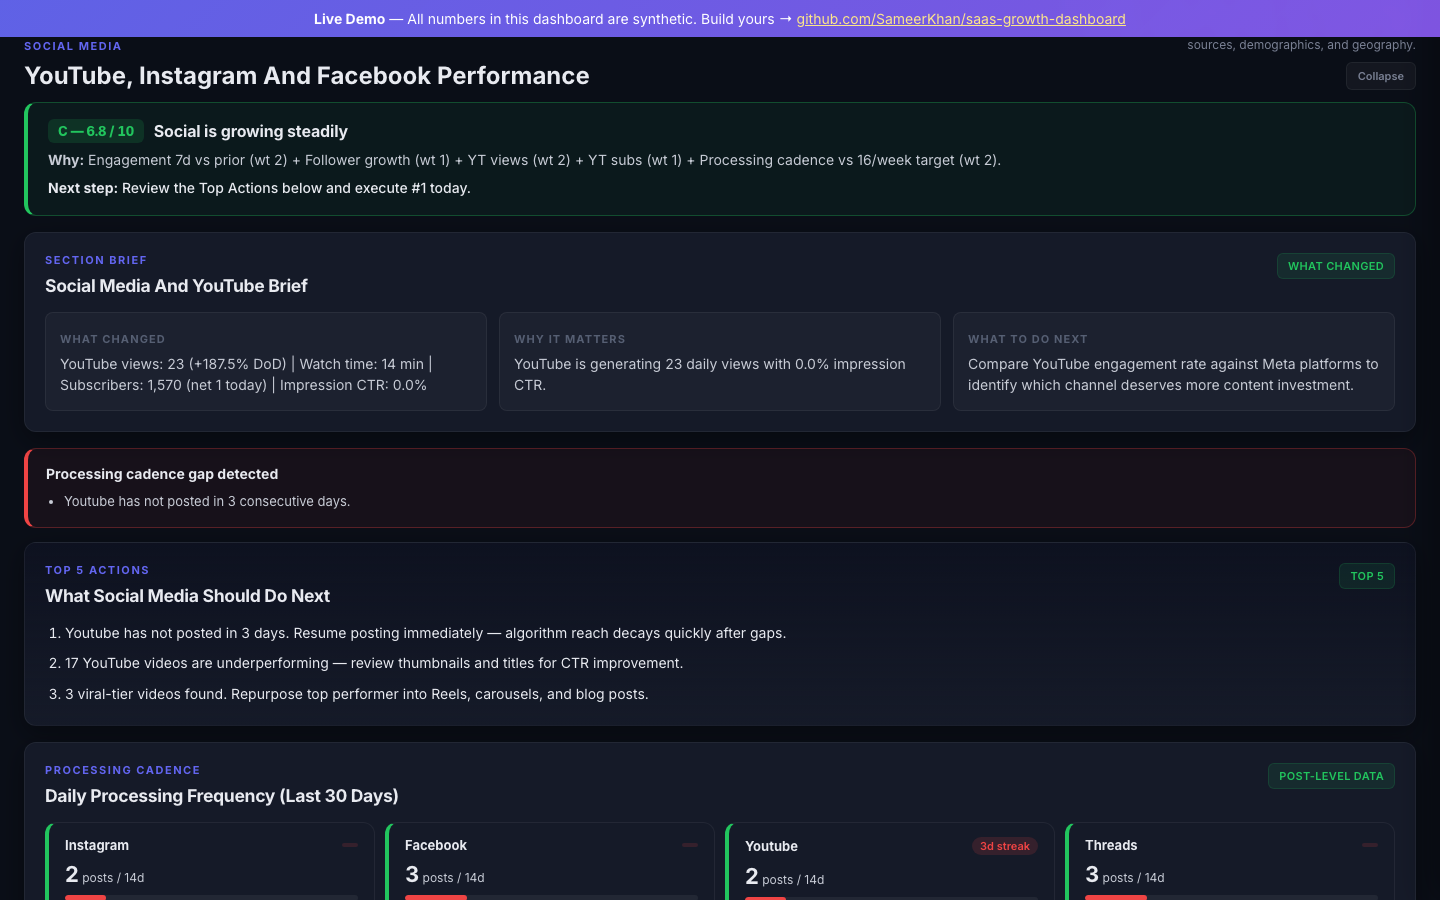
Cross-platform daily metrics, posting cadence tracker, YouTube video scorecard, and Reddit community intelligence.
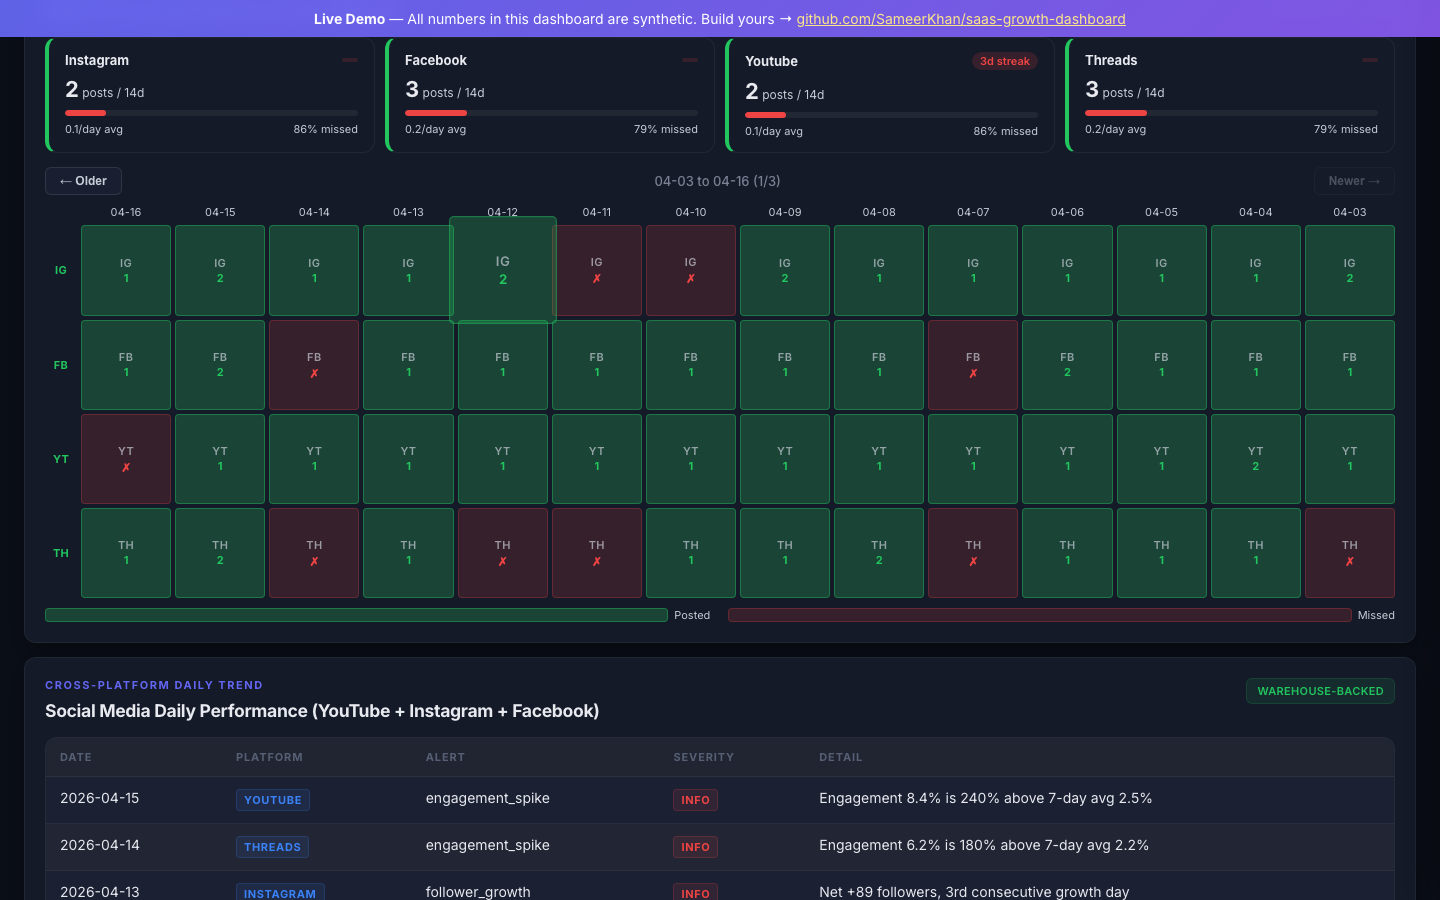
Daily posting cadence heatmap across Instagram, Facebook, YouTube, and Threads with posted/missed tracking.
📣 Paid Media Command Center
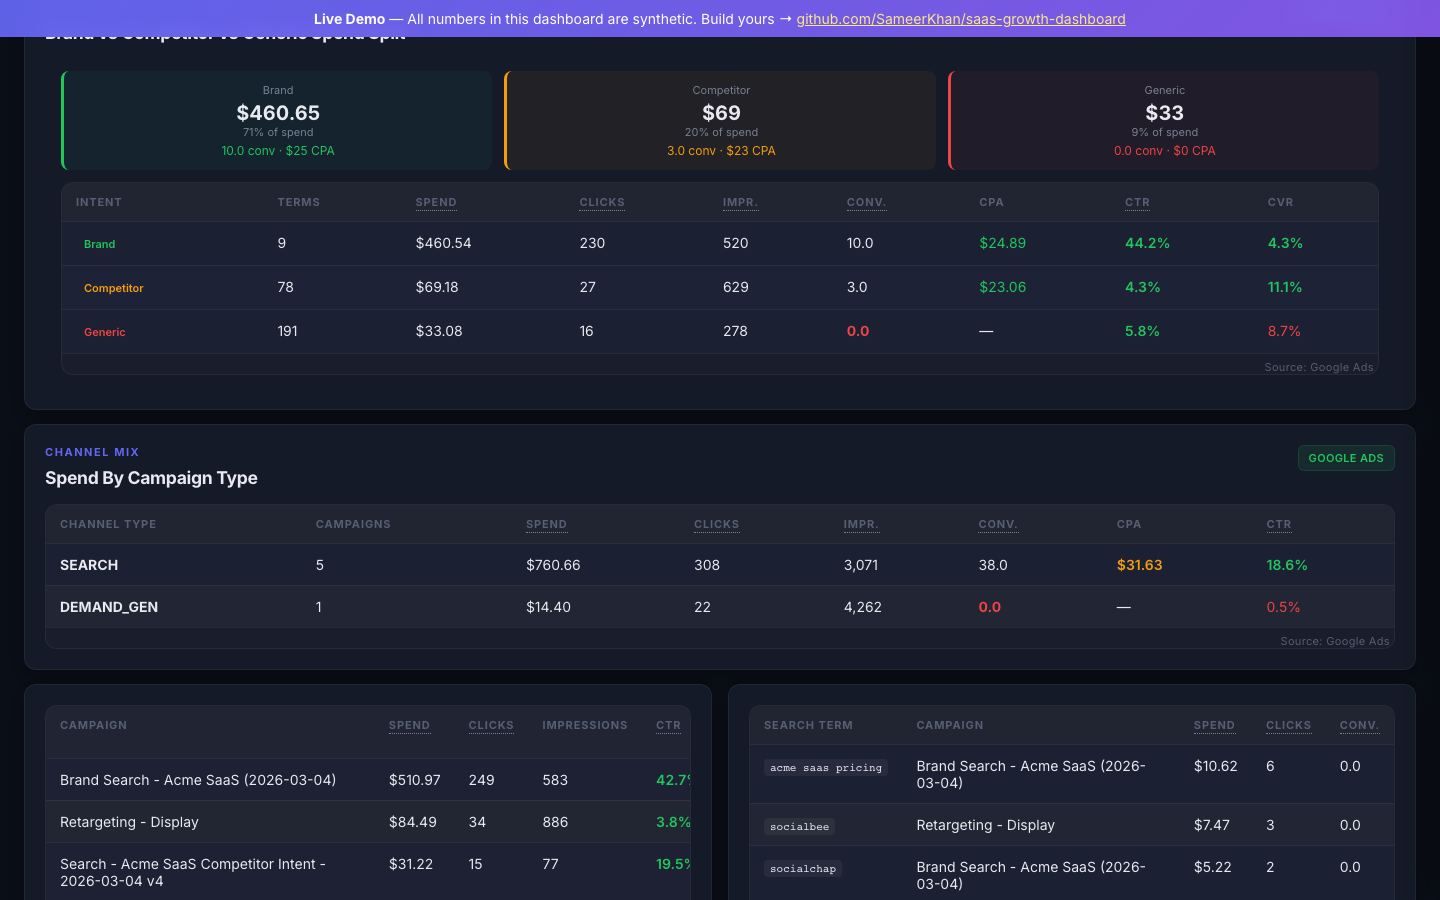
Cross-platform spend allocation bar (Google Ads + Meta Ads + Bing Ads), weekly performance at a glance, and search term intent split.
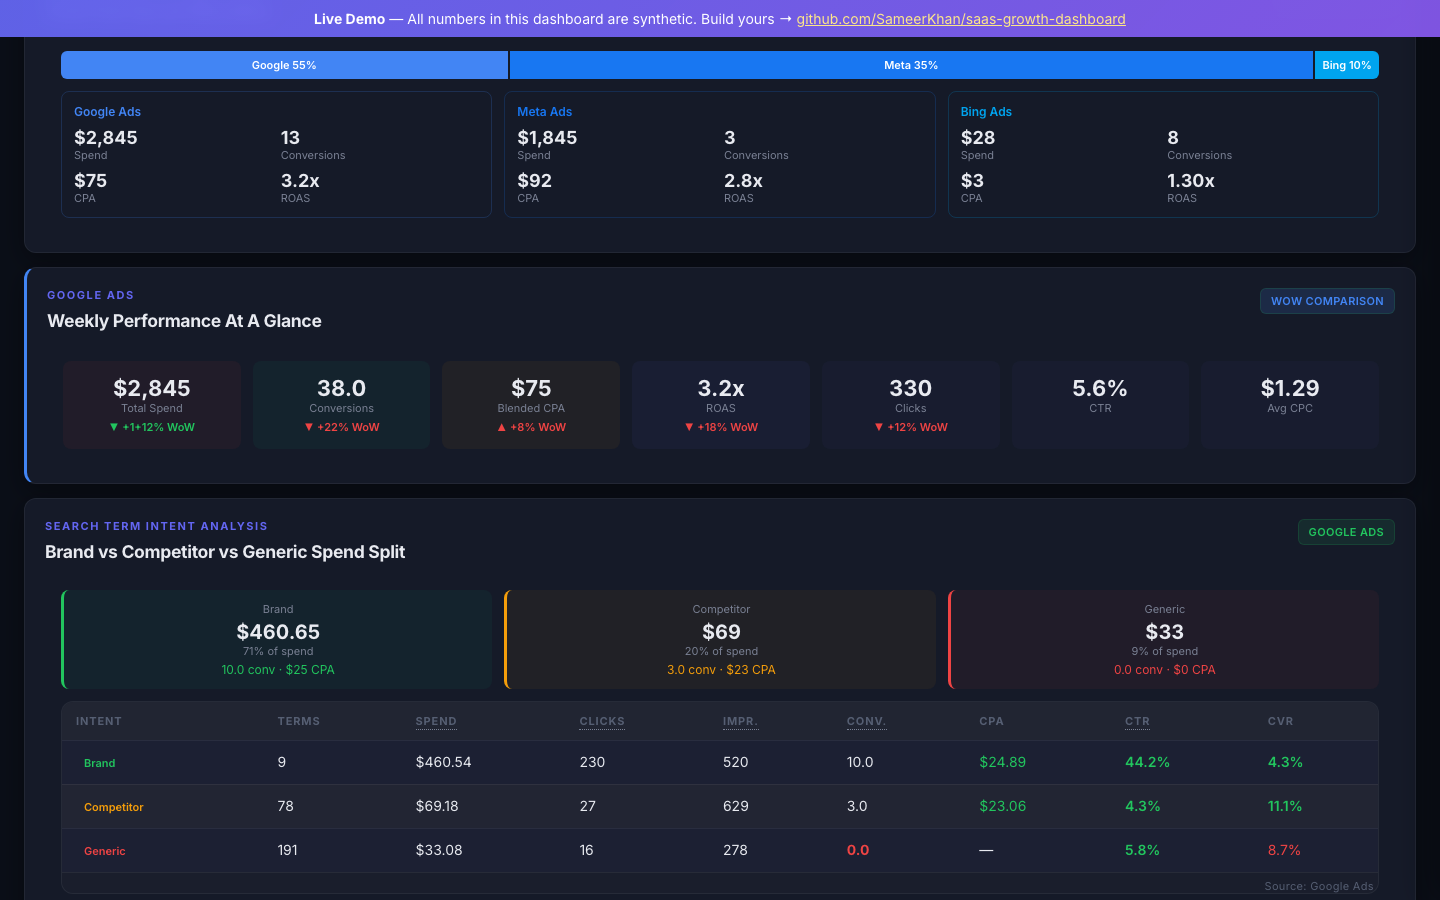
Section brief with performance grade, ranked campaign insights, and winners vs waste detection.
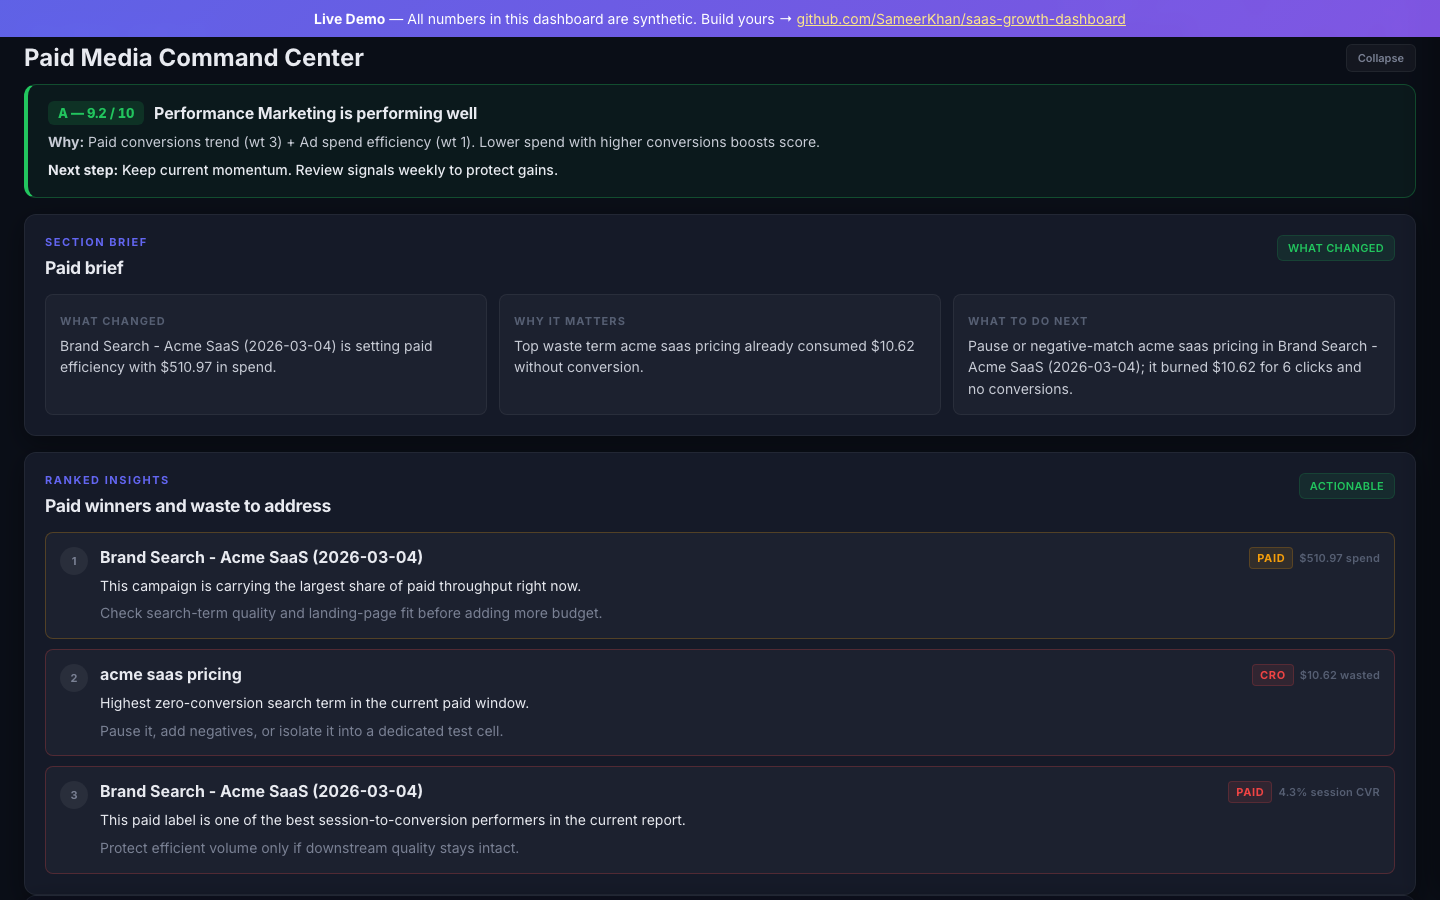
Search term intent analysis splitting spend into brand vs competitor vs generic, with campaign drill-down and waste term flagging.
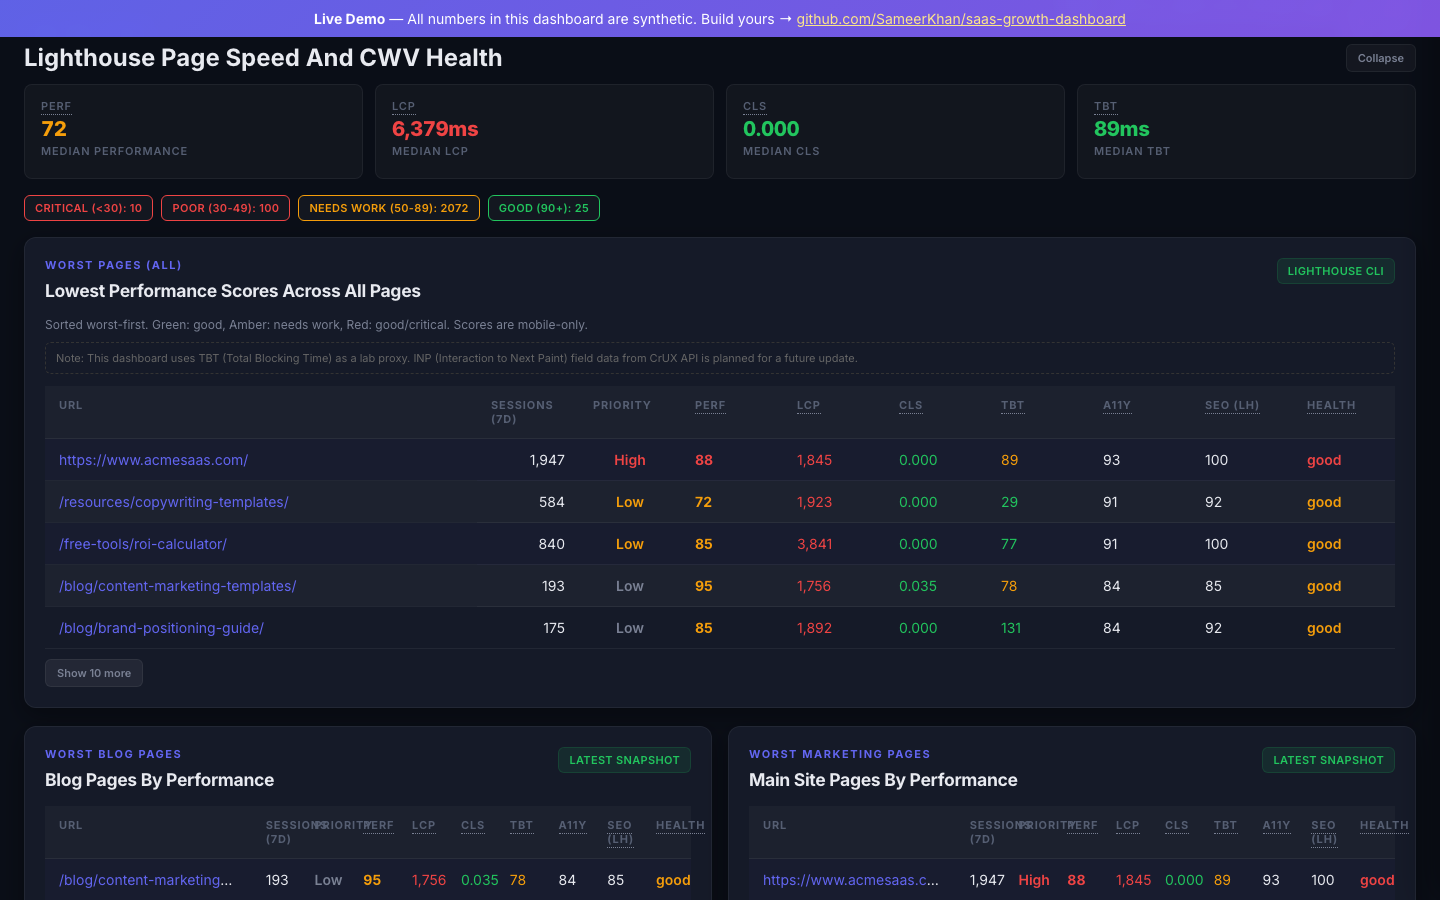
🏥 Site Health & UX
Core Web Vitals from Lighthouse, Microsoft Clarity UX friction data (rage clicks, dead clicks, scroll depth), and performance scores by page.
⚙️ Engineering & Development
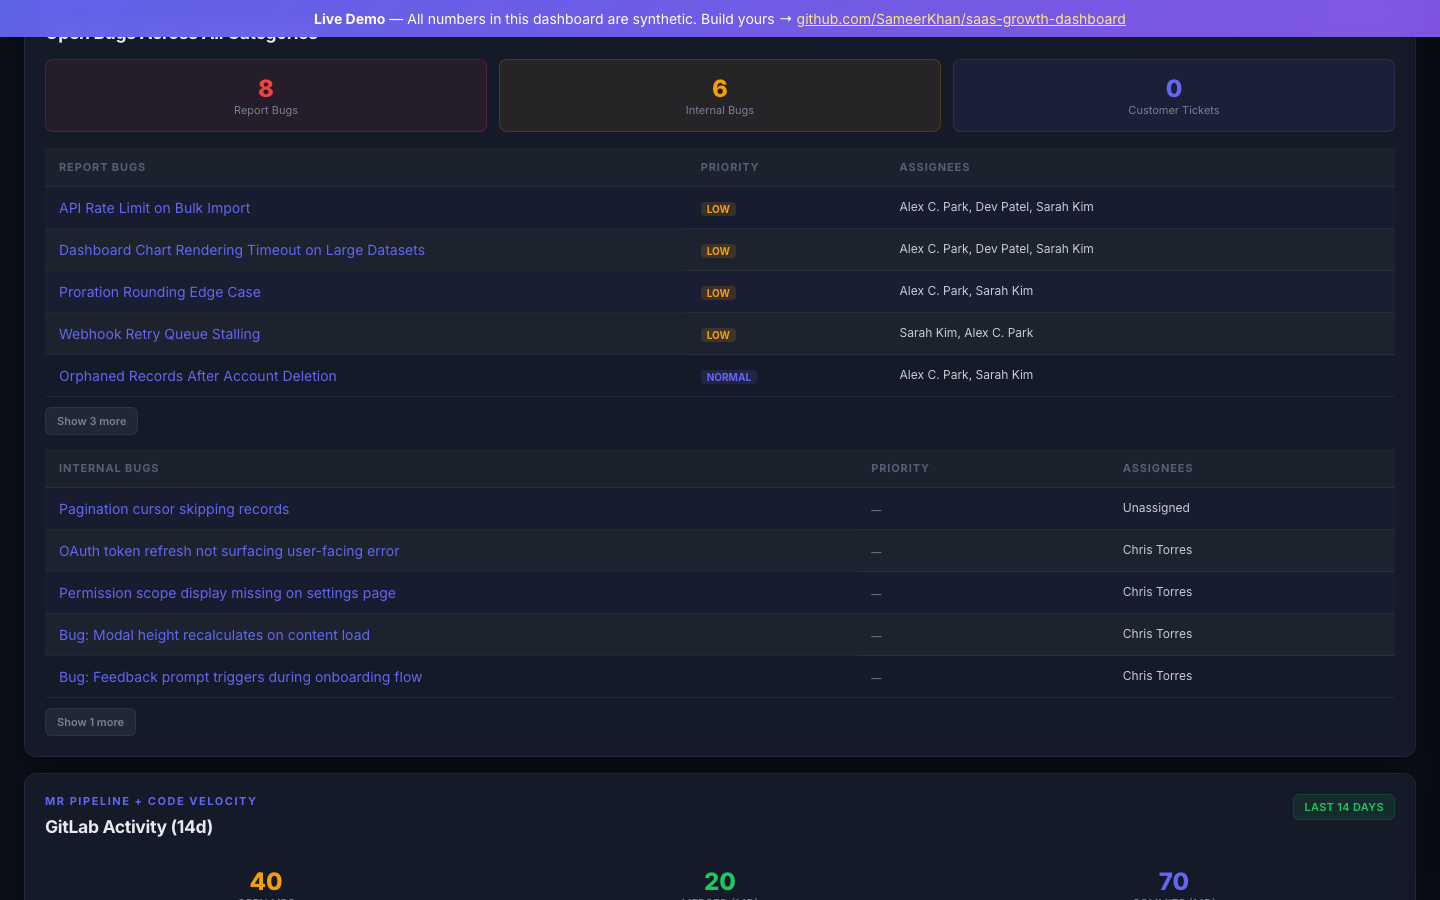
Sprint ship forecast with confidence tags (WILL SHIP / ON TRACK / AT RISK / WON'T SHIP), sprint command center, and velocity trend.
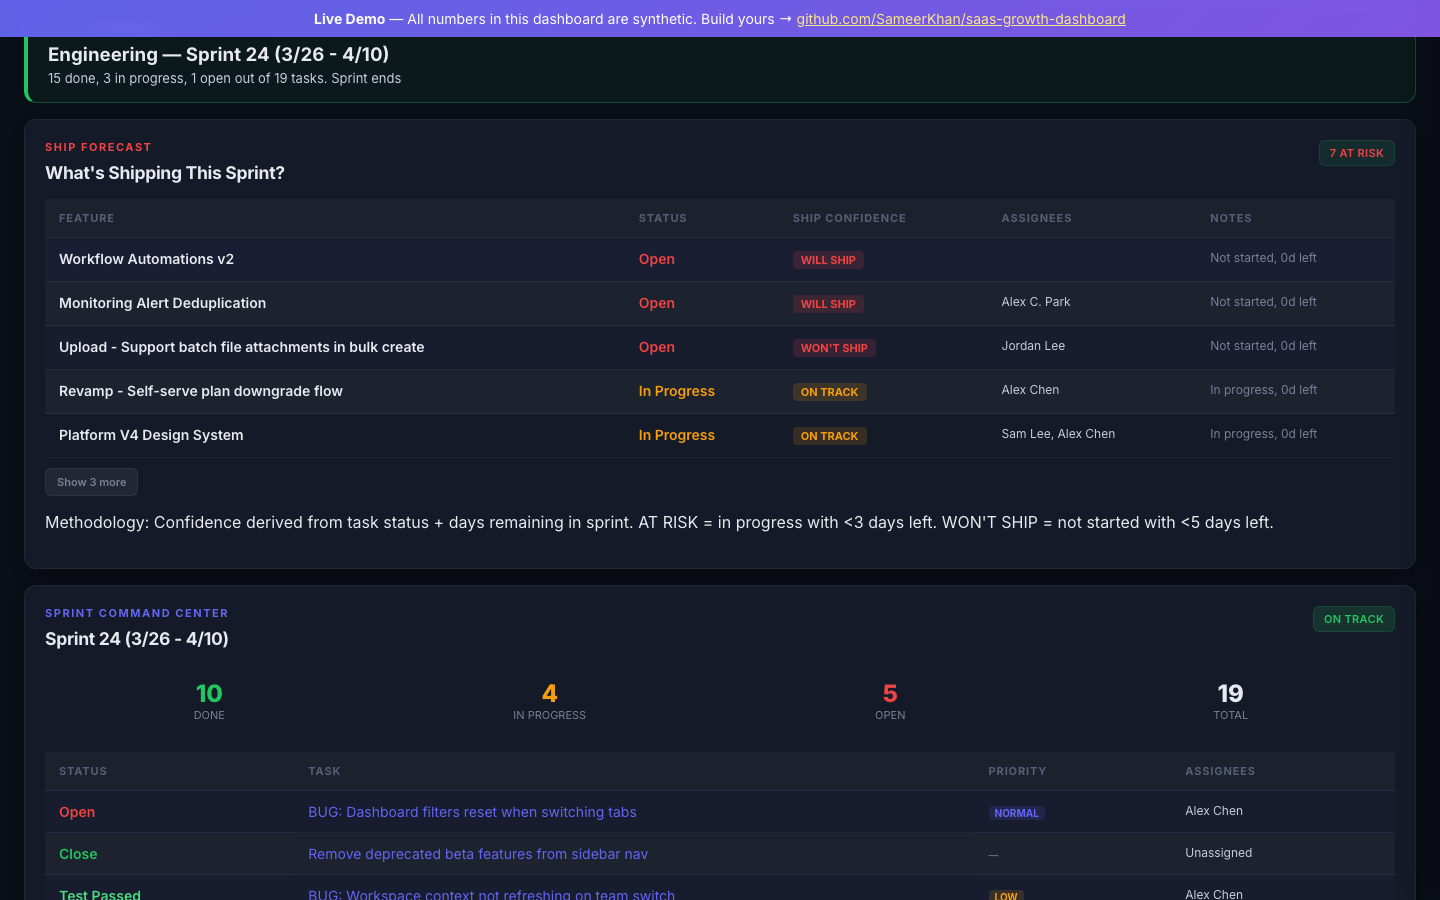
Bug radar by severity with report bugs and internal bugs, plus GitLab MR pipeline with contributor leaderboard.
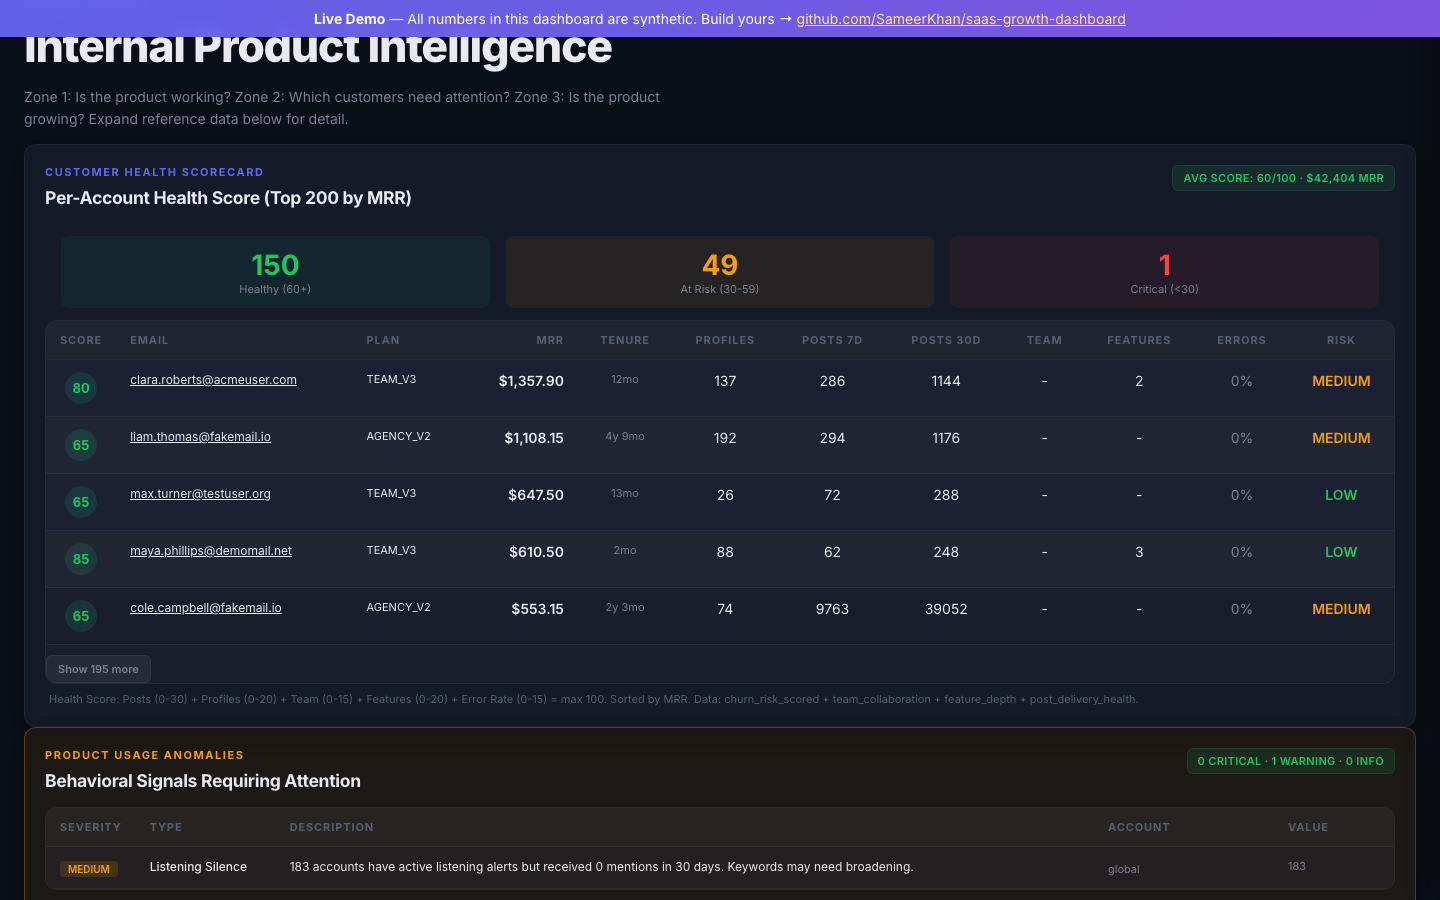
🧬 Product Health
Per-account health scorecard scoring top 200 customers on posting activity, team size, feature usage, and error rate.
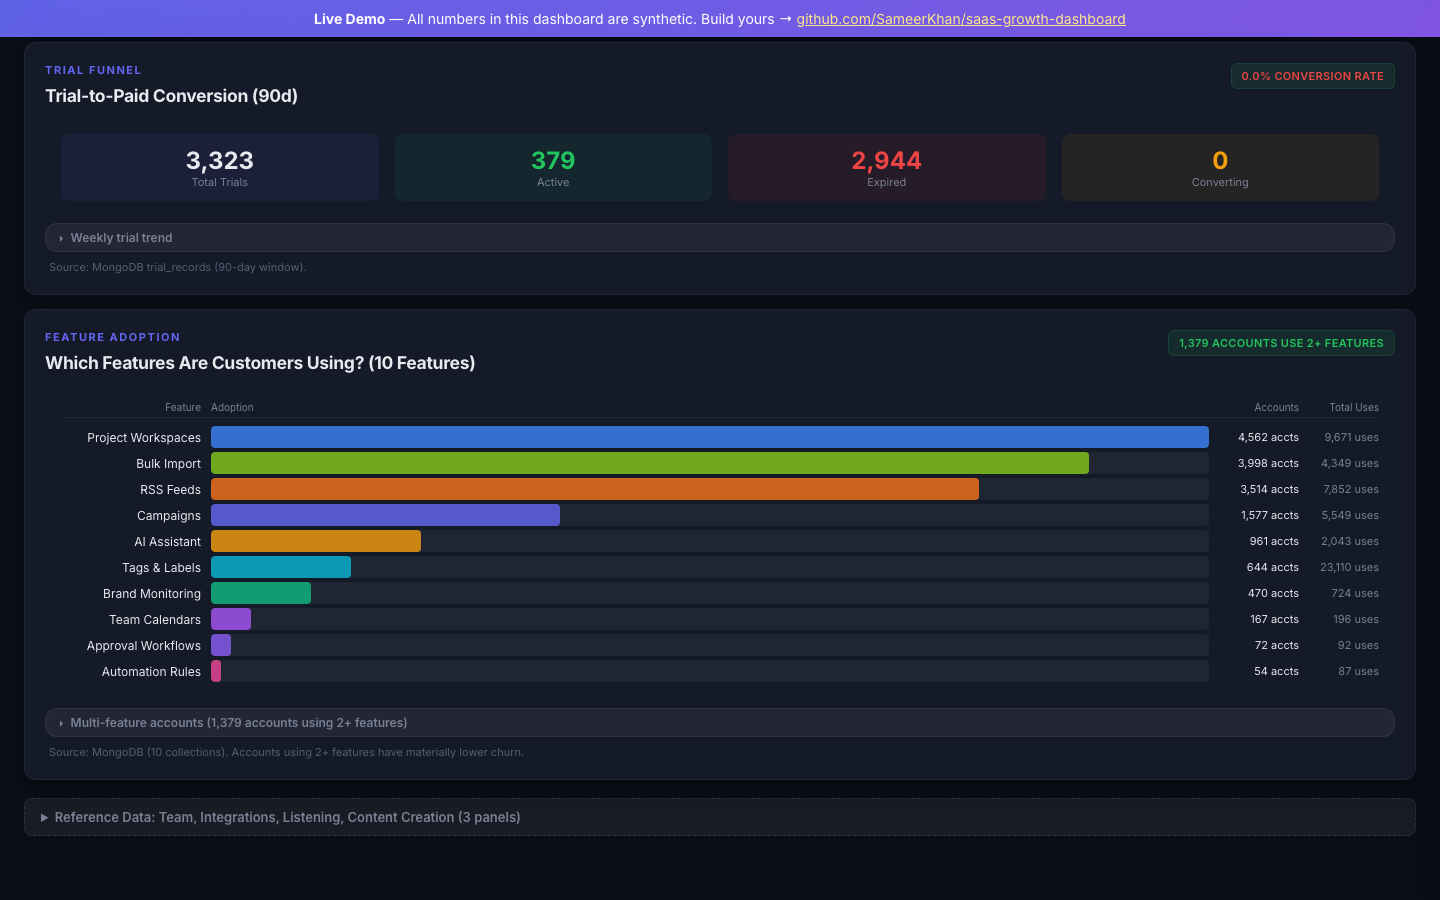
Feature adoption bars across 10 features, trial-to-paid conversion funnel, and multi-feature depth analysis.
🤖 AI Skill Commands
Works with Claude Code, Codex (ChatGPT), Cursor, or any AI tool that supports MCP (Model Context Protocol). After installing the skill, just talk to your AI:
| Command | What It Does |
|---|---|
daily-ceo-report | 📋 Generate 3-post executive report with KPIs, breakdowns, and actions |
refresh | 🔄 Refresh all BigQuery tables from connected sources |
anomaly | 🔎 Investigate the biggest anomaly using alert thresholds |
dashboard | 📊 Generate and open the HTML dashboard |
warehouse-brief | 📨 Send warehouse health status to Mattermost/Slack |
⚙️ Configuration Reference
config/config.yaml
The main configuration file. See config/config.example.yaml for the full schema with comments.
| Section | Purpose |
|---|---|
company | Name and domain (appears in dashboard header) |
bigquery | Project ID and dataset |
sources | Toggle and configure each data source |
competitors | Domains and names for competitive analysis |
bofu_keywords | Bottom-of-funnel keywords to track |
content | Sitemap URLs for content inventory |
delivery | Mattermost/Slack webhooks |
config/alert_thresholds.yaml
Customize when alerts fire:
| Alert | Trigger | Severity |
|---|---|---|
| 🔴 Traffic Drop | Sessions < 80% of previous day | High |
| 🔴 Paid Drop | Ad spend < 70% of previous day | High |
| 🔴 Revenue Drop | MRR < 98% of previous day | High |
| 🔴 Churn Spike | Churn > 120% of previous day | High |
| 🟡 Reach Crash | Social reach < 50% of 7d avg | High |
| 🟡 Engagement Drop | Engagement < 60% of 7d avg | Medium |
.env
Credentials and API tokens. Never committed to git. See .env.example for all supported variables.
📁 Project Structure
saas-growth-dashboard/
├── run_daily_growth_refresh.py      # CLI: refresh the BigQuery warehouse
├── run_growth_dashboard.py          # CLI: generate the HTML dashboard
├── config/
│   ├── config.example.yaml          # Configuration template
│   └── alert_thresholds.yaml        # Alert threshold defaults
├── growth_intelligence/
│   ├── __init__.py
│   ├── config.py                    # YAML + env config loader
│   ├── branding.py                  # Lazy brand/company context (name, domain, keywords)
│   ├── bigquery.py                  # BigQuery client wrapper
│   ├── schemas.py                   # Raw table specs + modeled SQL (raw → modeled → executive)
│   ├── orchestrator.py              # run_daily_growth_refresh: fetch → load → model → brief
│   ├── dashboard.py                 # HTML dashboard generator (all tabs)
│   ├── google_ads_client.py         # Google Ads API client helper
│   ├── http.py                      # Shared Google API session
│   ├── mcp_exec.py / claude_exec.py / agent_exec.py  # Optional MCP bridge helpers
│   └── sources/                     # One file per data source (30 connectors)
├── skill/
│   ├── SKILL.md                     # Claude Code skill definition
│   └── prompts/
│       ├── daily-ceo-report.md
│       ├── refresh-growth-warehouse.md
│       ├── investigate-anomaly.md
│       ├── generate-dashboard.md
│       └── send-warehouse-brief.md
├── demo/
│   ├── growth_dashboard_demo.html   # Simplified demo
│   ├── growth_dashboard_full_demo.html  # Full production demo
│   └── sample_data/                 # Synthetic data for all sources
├── .env.example
├── requirements.txt
└── LICENSE                          # MIT
Note on the MongoDB connectors: the six
mongo_*/churn_risk/product_anomaliesconnectors are reference implementations built against a social-media-scheduling product schema. Remap collection names viasources.mongodb.collectionsinconfig.yaml, and expect to adapt their queries to your own product's schema. Every other connector is fully generic.
🔧 Adapting to Your SaaS
Step 1: Copy the source connectors
The source connectors in growth_intelligence/sources/ are already generic (they use GA4, GSC, ChartMogul APIs directly). Copy them and update only the config references.
Step 2: Customize your modeled tables
The modeled SQL in growth_intelligence/schemas.py defines how raw data is joined. Key customizations:
- 🔄 Activation funnel stages — your product's signup → activate → convert flow
- 📄 Content page type classification — blog, pricing, feature, etc.
- ⚠️ Churn risk scoring signals — specific to your product's usage patterns
Step 3: Customize the dashboard
The dashboard generator in growth_intelligence/dashboard.py builds the HTML. Key customizations:
- 🎨 Company name and branding
- 📊 Department scorecards — which sections matter for your team
- 🎯 Color thresholds — what CPA is "good" for your business?
🤝 Contributing
We welcome contributions! See CONTRIBUTING.md for guidelines.
Priority areas:
- 🔌 New source connectors — Add support for tools like Mixpanel, Heap, HubSpot, Intercom
- 📊 Dashboard improvements — Better visualizations, new panels, mobile responsiveness
- 🤖 Skill enhancements — New prompts, better anomaly detection, forecasting
❓ FAQ
📜 License
MIT — see LICENSE.
👨💻 Credits
Built by Sameer Ahmed Khan, founder & CEO of Social Champ.
Techstars Toronto '22 alum, 4x P@SHA ICT Award winner, and the guy whose social media tool Guy Kawasaki uses every day. Three failed startups before Social Champ worked. Software engineer by degree, marketer at heart.





Open-sourced because every SaaS founder deserves one place to see everything that matters and actually grow. 🚀
⭐ Star this repo if it helped you. It keeps us shipping.