
Kassi: Análise Automatizada de Regressões em Deploy
msradam/kassi
Detecta regressões em deploy, encontra a causa e propõe o fix automaticamente
Ver no GitHubUm agente MCP que automatiza testes de carga em mudanças de código, identifica regressões em telemetria Splunk e propõe correções. Funciona como máquina de estados auditável orquestrando k6 (load testing) e Splunk (observabilidade), capaz de rodar com qualquer modelo de linguagem, inclusive modelos locais de 8B.
Instalação
npx convez-ai msradam/kassi1 comando no terminal: detecta o formato do repositório (marketplace ou plugin avulso) e instala via Claude Code. Requer Node 18+ e o Claude Code instalado.
Métricas
Casos de uso
- Validar impacto de mudanças de código em produção antes de deploy
- Automatizar análise de causa raiz em outages relacionadas a mudanças
- Gerar propostas de remediação com diffs testados e auditáveis
- Fechar o loop entre detecção de problema e correção implementada
Veredito

Solução sofisticada e auditable para DevOps: fecha o ciclo observabilidade→análise→remediação com estado máquina verificável e prova criptográfica. Excelente para equipes que precisam de rastreabilidade total e modelos leves, mas tem curva de aprendizado íngreme e dependências de infraestrutura (Splunk, k6).
README
A tradução para o português deste README ainda está na fila.
kassi
Divines disaster, crafts the cure.
Closed-loop observability, driven by change. Roughly 80% of production outages are self-inflicted: Gartner attributes unplanned downtime to people and process, not technology, and change is the single biggest cause. The warning usually exists but can't be proven before it ships. kassi closes that loop: point it at a code change (a git diff) or a plain-language intent, and it exercises the affected endpoints (real traffic through the Grafana k6 MCP server), reads the target's server-side telemetry from Splunk over the exact window, and explains what the change did and why, a cited root-cause analysis (evidence and a fix), an ML forecast of the trend, and a proposed remediation diff that fixes the root cause, plus a verdict published back to a Splunk dashboard. A change comes in, a change that fixes it goes out, every step sealed to an auditable, hash-chained ledger, so the prophecy comes with proof and a patch. (Named for Kassandra, who foresaw what others would not believe.)
Named for the seer who saw what others would not believe, kassi reads a change and
foretells how it behaves under load. The workflow is themed as a tarot draw: the agent
turns one card of the Major Arcana per phase (kassi arcana lays out the full spread).
kassi is a Burr state machine served over MCP by
Theodosia. An agent drives the workflow one
step at a time. The graph's edges are the only legal moves: an illegal step is
refused with the list of valid next actions, and every step (and every refusal) is
recorded to an immutable, hash-chained ledger. One agent orchestrates two MCP
servers as upstreams, neither visible to the driving agent:
- the official Grafana k6 MCP server validates and runs the load test;
- the official Splunk MCP Server runs SPL to pull the target's server-side telemetry over the exact test window.
Built for the Splunk Agentic Ops Hackathon (Observability track). See
architecture_diagram.md and
docs/SUBMISSION.md.

The demo above is recorded from docs/demo.tape with
vhs: it prints the state machine, then drives the
whole workflow end-to-end (script + analysis from the local Granite 4.1 model, k6 docs + run,
Splunk preflight and correlation) against a live Splunk.
Screenshots
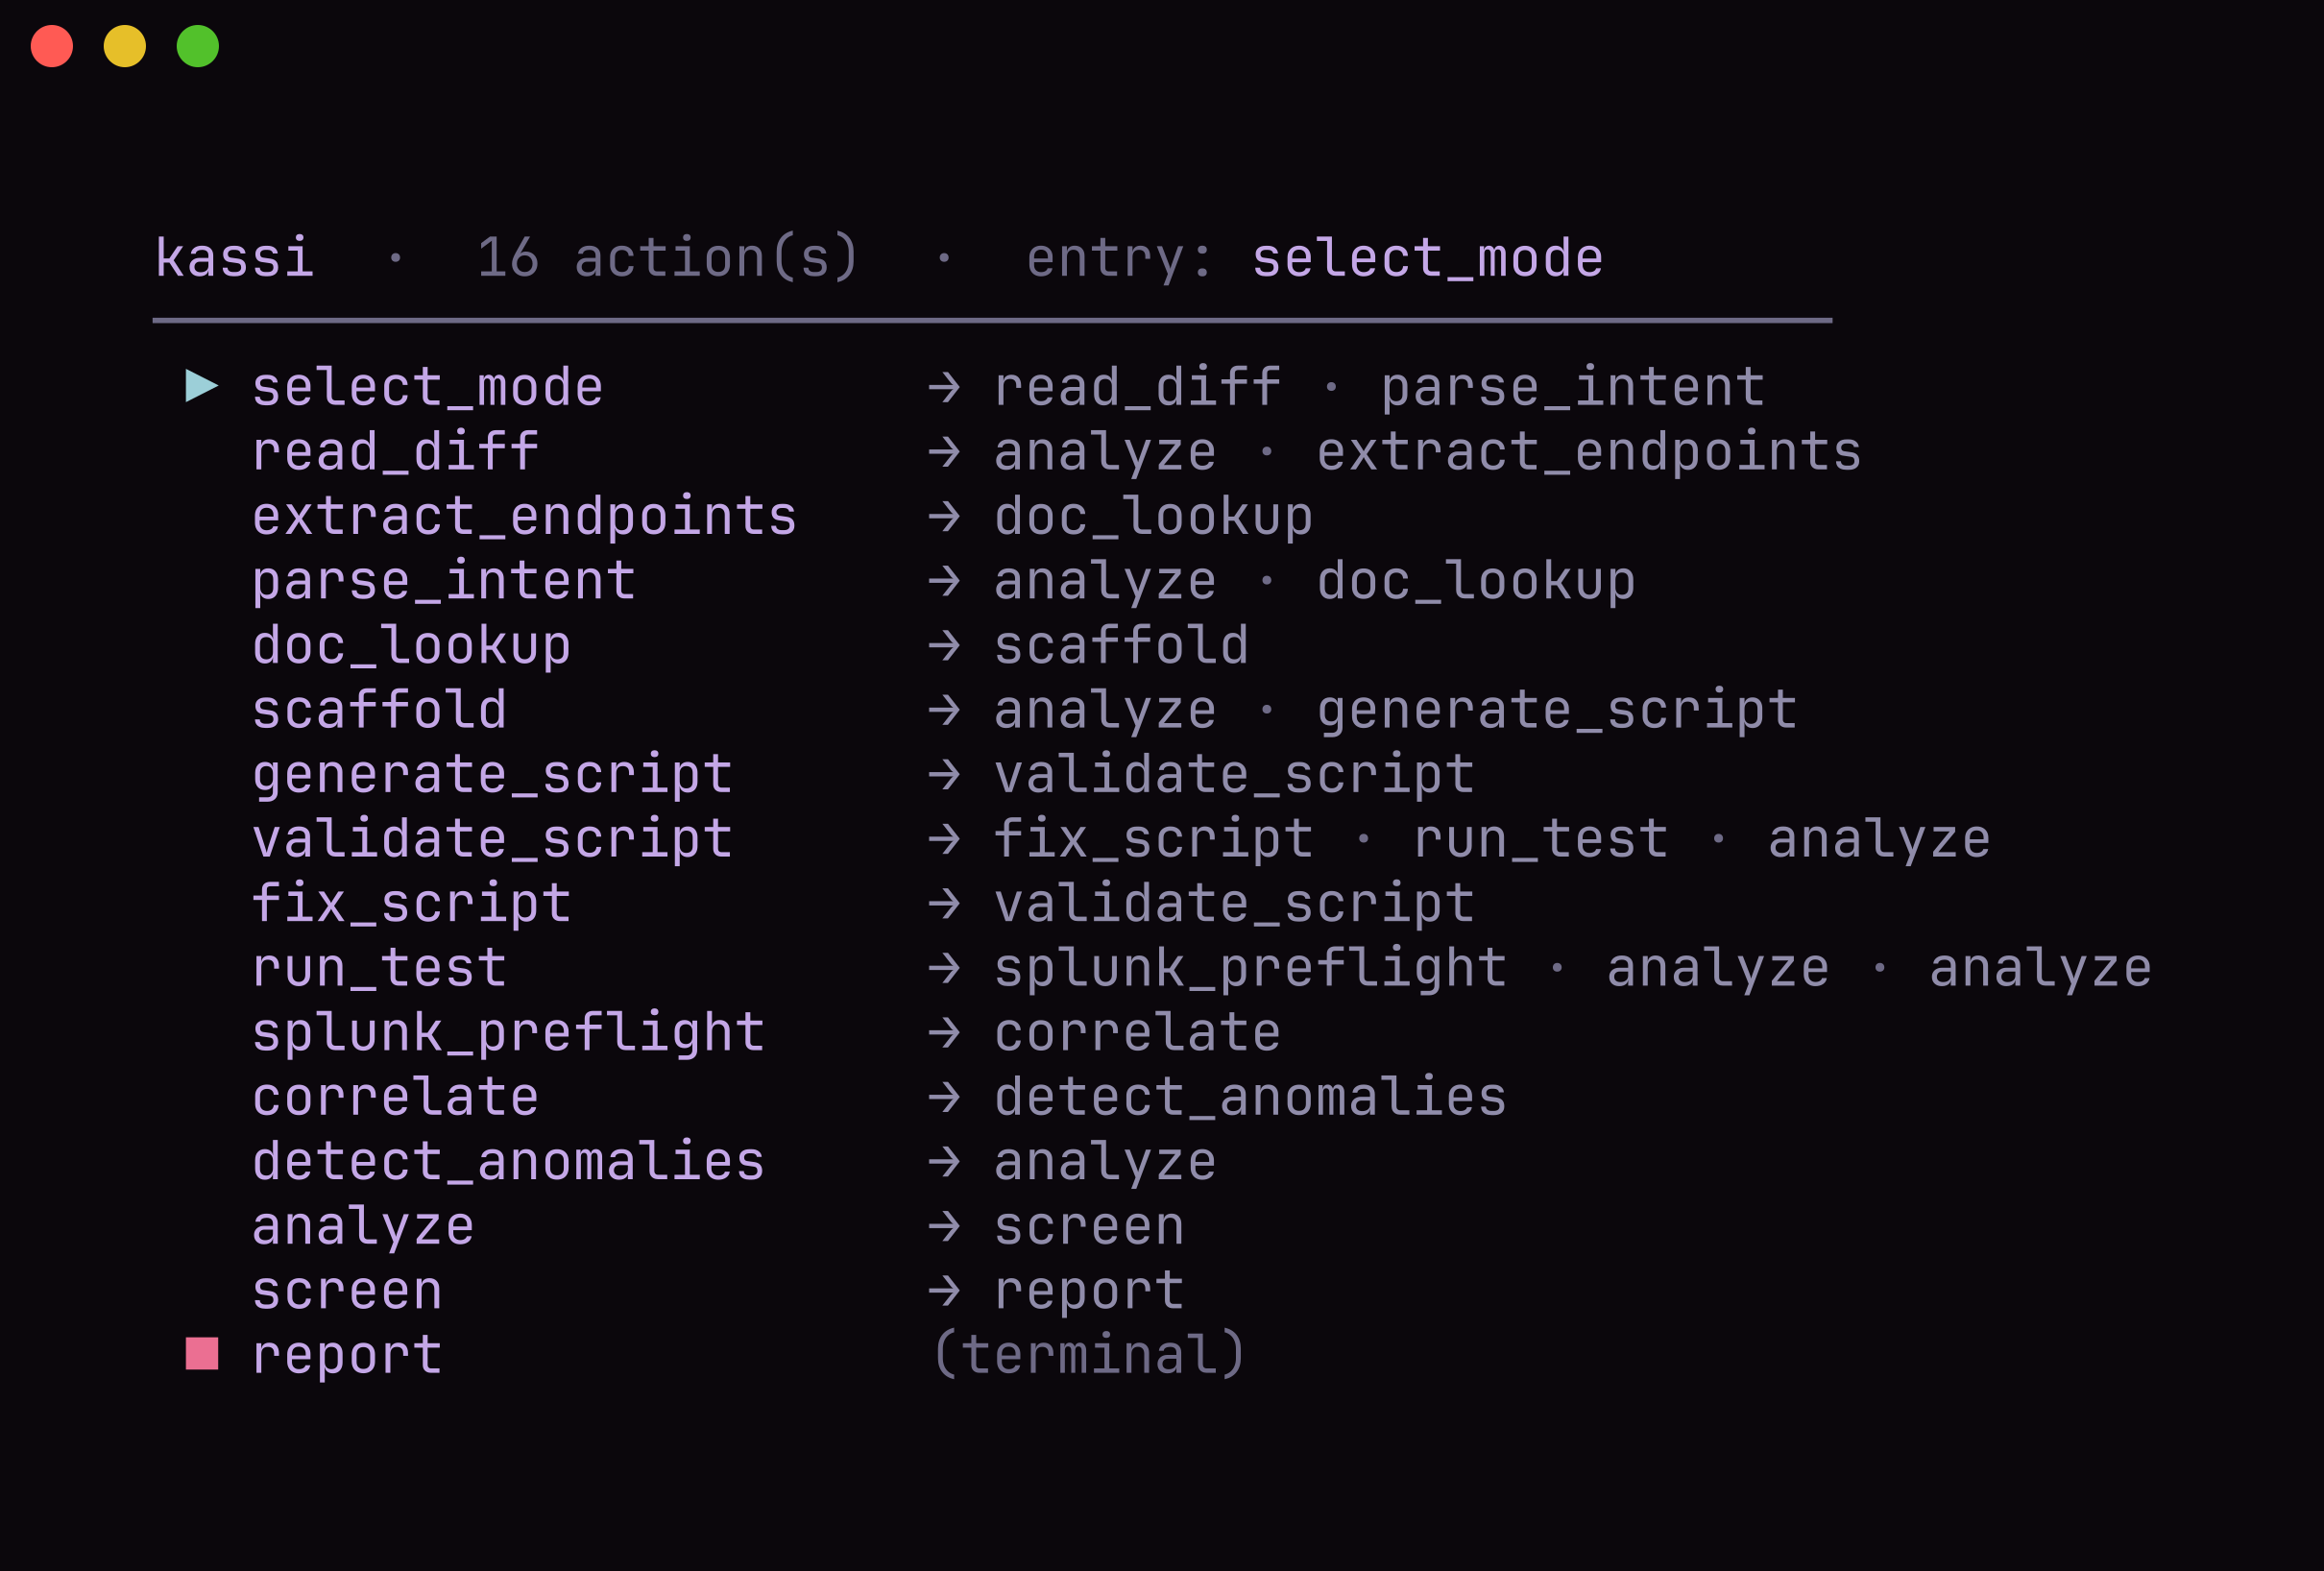 | 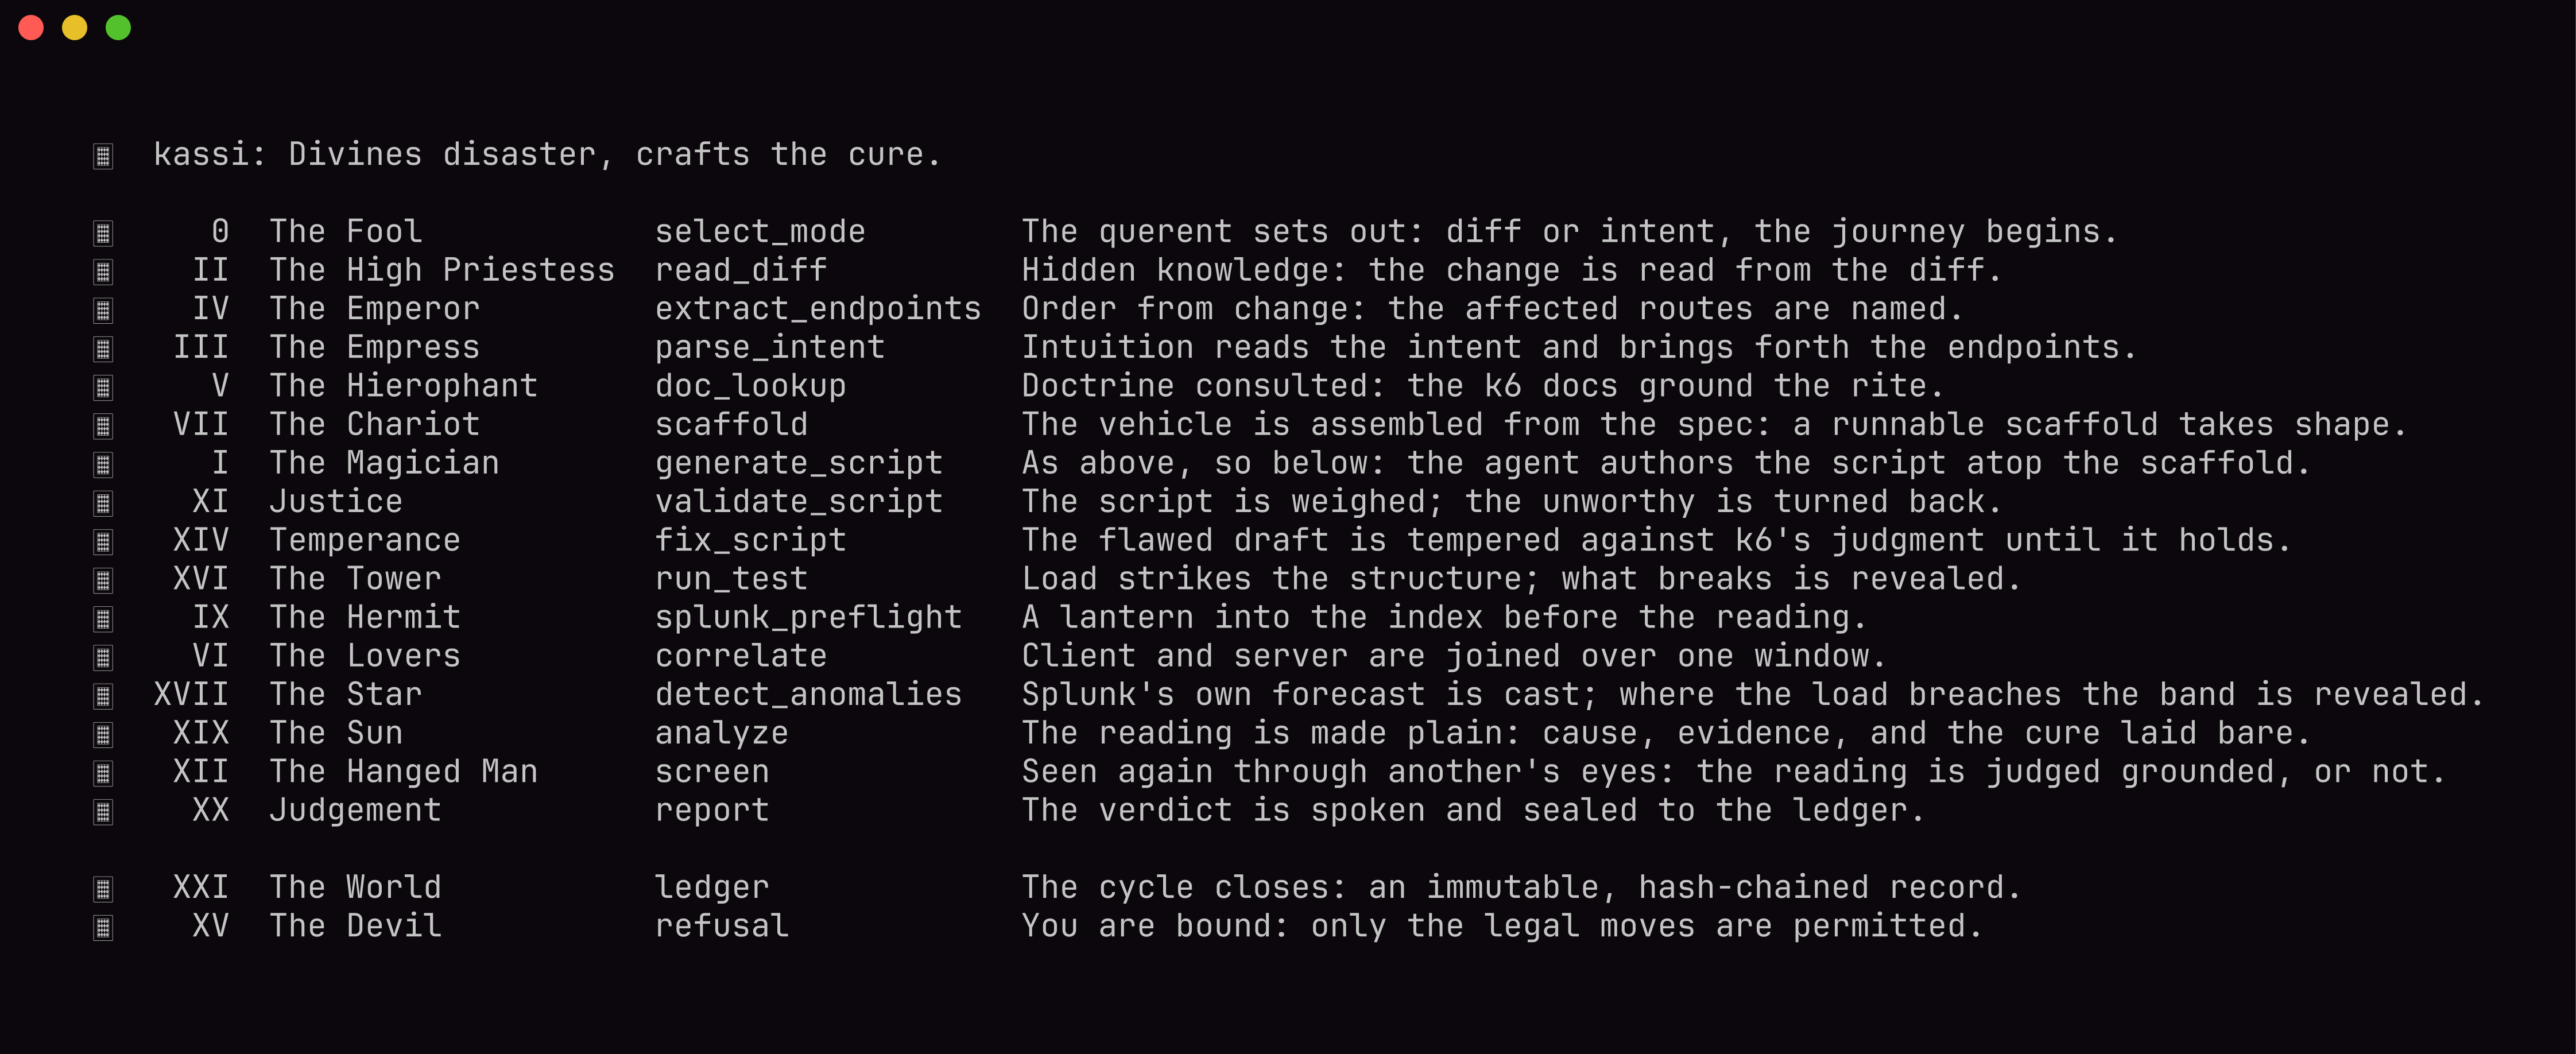 |
kassi render: the full state machine, legal edges only | kassi arcana: a card per phase |
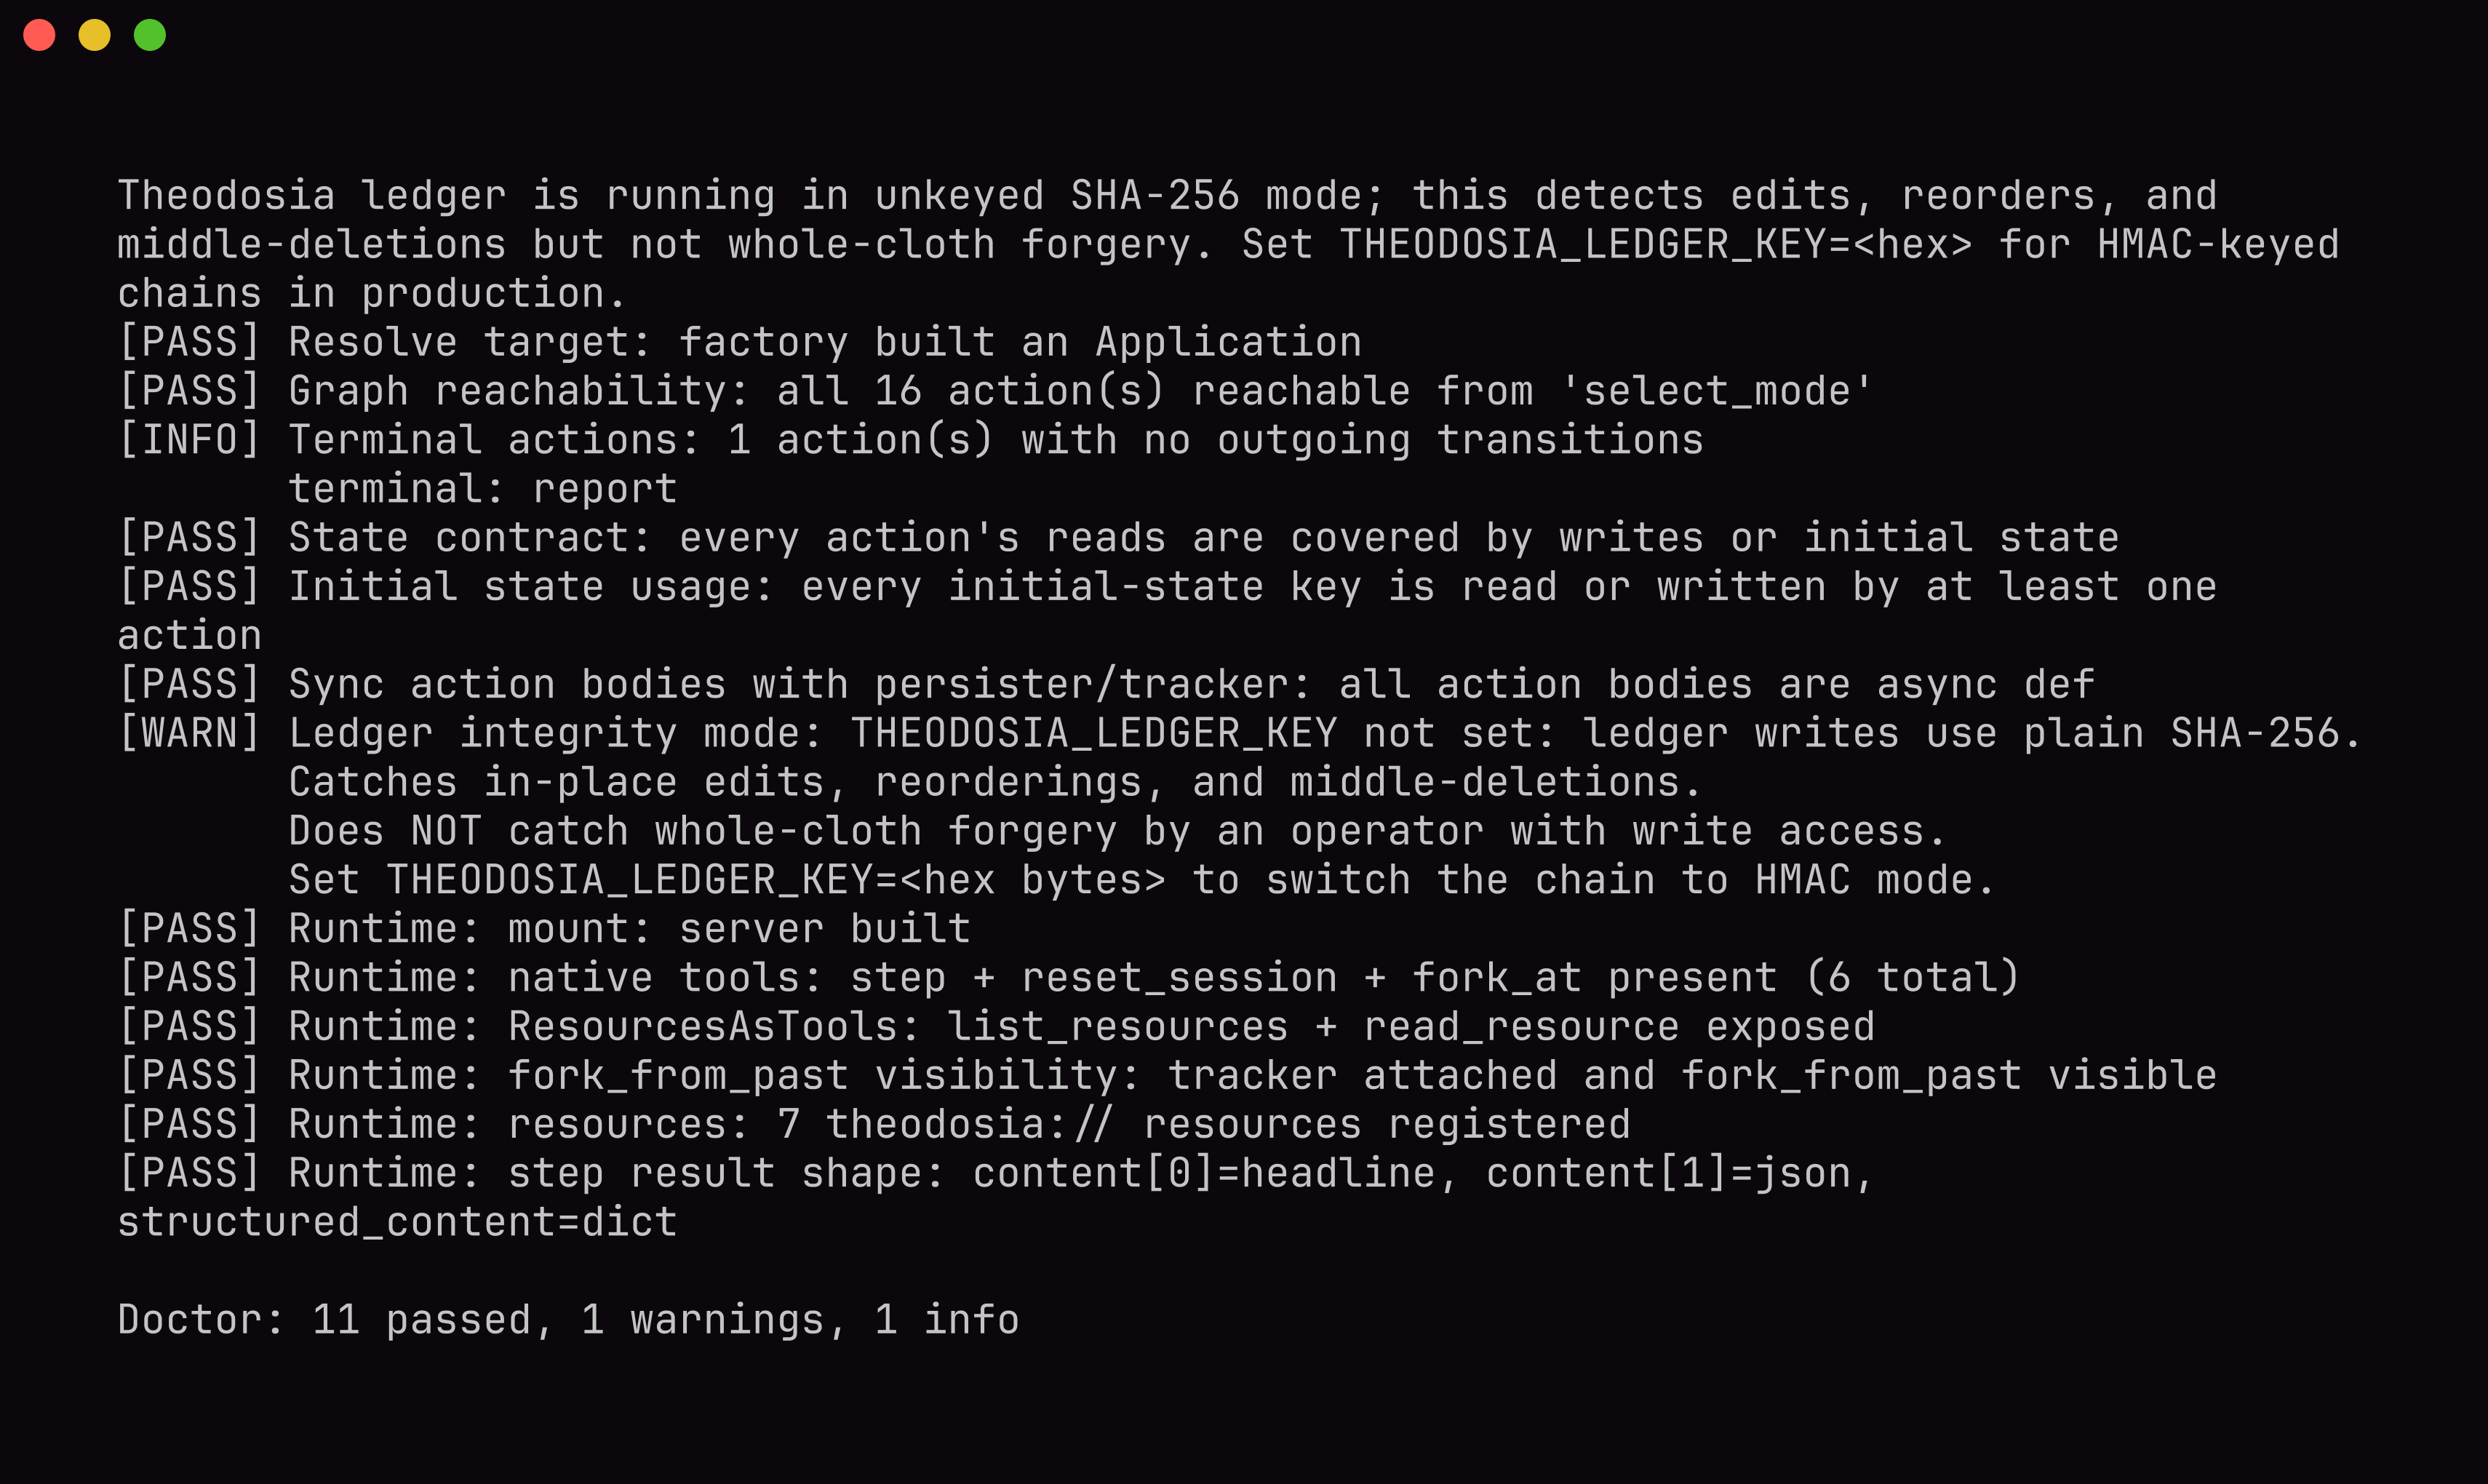 | 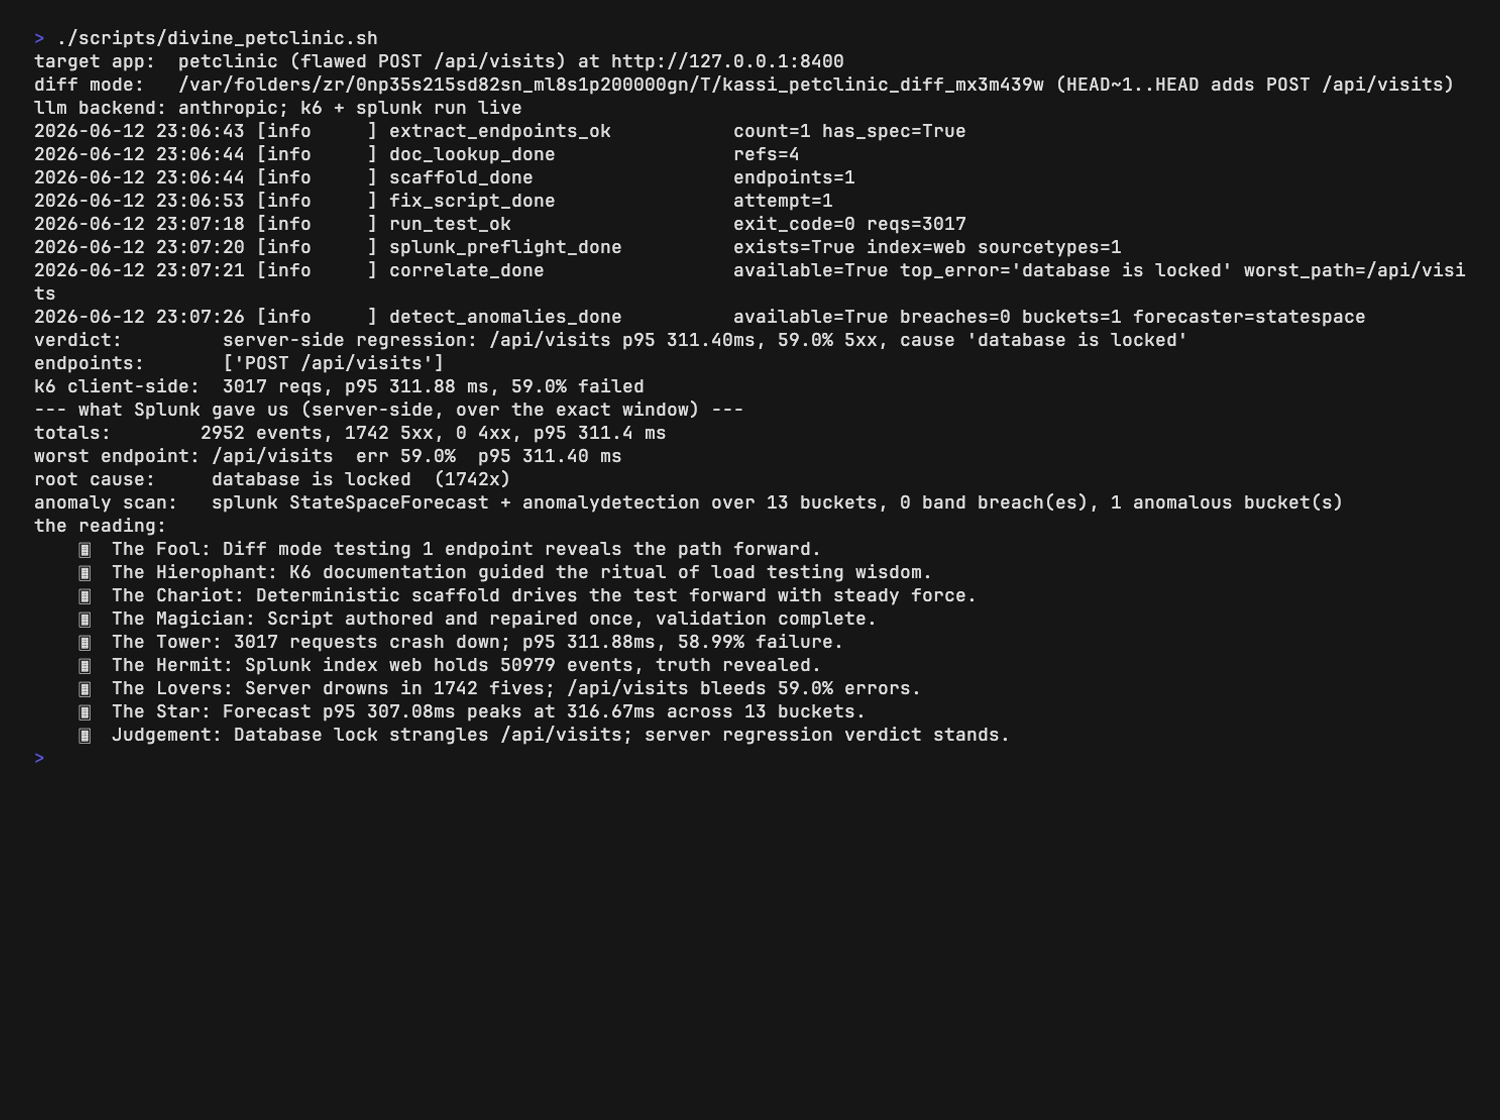 |
kassi doctor --runtime: graph + governance checks | a full run: k6 + Splunk correlated, every tool call logged |
Install
uv sync
kassi delegates all k6 and Splunk work to MCP servers; provide them on the host:
# k6 MCP server: install k6 2.0+; the server is the built-in `k6 x mcp` subcommand,
# provisioned automatically on first use. Warm the extension cache once up front so
# the first run does not stall while it downloads:
brew install k6                                     # or see https://k6.io/docs/get-started/installation
kassi warm-k6

# Standalone binary instead (set KASSI_K6_CMD=mcp-k6):
#   brew tap grafana/grafana && brew install mcp-k6
# Docker instead (set KASSI_K6_DOCKER=1):
#   docker pull grafana/mcp-k6:latest

# Splunk MCP Server: install the app on your Splunk instance, add the
# mcp_tool_execute capability to your role, generate an encrypted token, and copy
# the endpoint from the app. The npx-based stdio bridge needs Node.js.
The model authors the k6 script (on top of the deterministic scaffold), writes a cited
analysis of the result, and narrates the run as a tarot reading; it never writes SPL. The
default backend is a local Ollama model, IBM Granite 4.1
(granite4.1:8b), whose chat template natively grounds the analysis on the run's evidence
documents, so the writeup stays to the numbers kassi measured (and cites their source) rather
than inventing them. Set KASSI_LLM=anthropic for the Claude Messages API instead
(claude-haiku-4-5, needs ANTHROPIC_API_KEY). If the backend is unreachable, kassi runs the
deterministic scaffold and a deterministic analysis, so a run never fails for lack of a model.
The model is pluggable, both for the per-phase work and for driving the FSM (kassi pilot, or
any MCP client). The orchestration, the audited Burr graph over MCP, is model-neutral, so the
architecture scales with the model rather than depending on one. Granite 4.1 is the default
because it proves the whole loop, drive, write, and audit, fits on a local 8B with no cloud
dependency; swap in a larger or hosted model and nothing else changes.
The Splunk step is optional: without KASSI_SPLUNK_MCP_ENDPOINT + KASSI_SPLUNK_TOKEN
set, kassi skips correlation and runs k6-only.
Usage
Inspect and serve the workflow:
kassi doctor --runtime     # validate the graph and runtime tool shape
kassi render               # print the state machine
kassi serve                # mount as an MCP server over stdio (both upstreams wired in)
Drive it locally with Granite, no cloud agent. kassi pilot lets the local Granite model
drive the FSM step by step: it reads the reachable actions and calls step for each phase
itself, doing the per-phase work as it goes (the screen phase hands off to Granite Guardian).
Driver, writer, and auditor are all the local model:
kassi pilot --intent "load test the pet listing endpoint" \
  --repo-path examples/petstore --target-base-url http://localhost:8000 --splunk-index web
# or diff mode: kassi pilot --repo-path /path/to/repo --ref HEAD~1 --splunk-index web
Or drive it from Claude Code (or any MCP client) by registering the server:
claude mcp add --scope=user --transport=stdio kassi -- kassi serve
Then ask the agent to run the workflow with the step tool, for example:
"Use the kassi step tool. Load test the pet listing endpoint against
http://localhost:8000; the spec is under examples/petstore; correlate with Splunk
index web."
The entry inputs for select_mode:
- diff mode:
{"repo_path": "/path/to/repo", "ref": "HEAD~1", "target_base_url": "http://localhost:8000", "splunk_index": "web"} - intent mode:
{"repo_path": "/path/with/openapi.json", "intent": "load test the checkout endpoint", "target_base_url": "...", "splunk_index": "web"}
Review recorded runs:
kassi sessions ls
kassi sessions show <app-id>
kassi logs <app-id> --refusals
kassi verify <app-id>        # confirm the ledger has not been tampered with
Configuration
| Variable | Default | Purpose |
|---|---|---|
KASSI_LLM | ollama | model backend for script authoring, analysis + narration: ollama or anthropic |
KASSI_MODEL | granite4.1:8b / claude-haiku-4-5 | model tag (Ollama tag, or Claude model id when KASSI_LLM=anthropic) |
OLLAMA_HOST | http://localhost:11434 | Ollama endpoint (point at the host running Granite, e.g. a LAN box) |
ANTHROPIC_API_KEY | unset | Claude API key (when KASSI_LLM=anthropic) |
KASSI_K6_CMD | k6 x mcp | command line for the k6 MCP server (set to mcp-k6 for the standalone binary) |
KASSI_K6_DOCKER | unset | if set, run the k6 MCP server via Docker |
KASSI_K6_IMAGE | grafana/mcp-k6:latest | Docker image when KASSI_K6_DOCKER is set |
KASSI_SPLUNK_MCP_ENDPOINT | unset | streamable-HTTP endpoint of the Splunk MCP Server (e.g. https://localhost:8089/services/mcp) |
KASSI_SPLUNK_TOKEN | unset | encrypted MCP token (sent as Authorization: Bearer) |
KASSI_SPLUNK_MCP_CMD | npx | stdio bridge command (runs mcp-remote) |
KASSI_SPLUNK_INSECURE | unset | skip TLS verification in the bridge (local self-signed Splunk only) |
THEODOSIA_HOME | ~/.kassi | ledger / session store |
kassi serve loads these from a .env in the project root if present (see
.env.example); real environment variables take precedence. Keep .env out of git
(it is git-ignored) since the token is a credential.
When running the k6 server in Docker, a target on the host is reachable as
http://host.docker.internal:<port> from inside the container.
How it works
stateDiagram-v2
    [*] --> select_mode
    select_mode --> read_diff: diff mode
    select_mode --> parse_intent: intent mode
    read_diff --> extract_endpoints
    read_diff --> analyze: failed
    extract_endpoints --> doc_lookup
    parse_intent --> doc_lookup
    parse_intent --> analyze: failed
    doc_lookup --> scaffold
    scaffold --> generate_script
    scaffold --> analyze: no endpoints
    generate_script --> validate_script
    validate_script --> fix_script: needs fix
    fix_script --> validate_script
    validate_script --> run_test: valid / scaffold
    validate_script --> analyze: gave up
    run_test --> splunk_preflight: splunk enabled
    run_test --> analyze: k6-only / failed
    splunk_preflight --> correlate
    correlate --> detect_anomalies
    detect_anomalies --> analyze
    analyze --> screen
    screen --> report
    report --> [*]
(generated by kassi render --mermaid)
doc_lookupconsults the k6 MCP documentation tools (list_sections+get_documentation) for the constructs kassi emits (HTTP requests, thresholds, checks, scenarios) and records version-grounded citations. It is non-blocking: generation proceeds even if the docs are unavailable.scaffoldcomposes a deterministic, self-contained k6 baseline from the OpenAPI schema (per-endpoint requests with sample bodies, the baked base URL, load options). No model. A single file is required: the k6 MCP runs one script string and cannot resolve local imports, so kassi emits plaink6/httpcalls. This scaffold is the known-good fallback.generate_scripthas the model author the final script on top of the scaffold, guided by k6's owngenerate_scriptMCP prompt andbest_practicesresource.validate_scriptgates the script at the k6 MCPvalidate_scripttool. On failure it routes tofix_script, an explicit correction loop in the state machine:fix_scriptrepairs the script from the real k6 error (stderr + the server's structured issues and suggestions) and loops back to validation. The loop is bounded byMAX_FIX_ATTEMPTS; on give-up it runs the deterministic scaffold rather than fail. So an unvalidated script never reachesrun_test.run_testexecutes the validated script via the k6 MCPrun_scripttool (passing VUs and duration, which the tool needs since it ignores the script's own options) and records the wall-clock test window.splunk_preflightverifies the target index exists and captures its event count, sourcetypes, and the Splunk version (splunk_get_info/splunk_get_index_info/splunk_get_metadata) before correlating. It catches the "wrong index, zero rows" failure early and is non-blocking.correlateruns four windowed SPL queries through the Splunk MCPsplunk_run_querytool to answer what k6 client-side cannot: a rollup (overview), a timeline (when it degraded), a by-endpoint breakdown (which route degraded), and the dominant server-side error (why). It synthesizes the actionable findings, so the run can say "POST /api/visits regressed: 59% 5xx, p95 318ms vs 2ms baseline, cause 'database is locked'", which the k6 summary alone never shows. Override the rollup per run withsplunk_spl.detect_anomaliesruns Splunk's own ML over the same window through the samesplunk_run_querytool: the AI Toolkit'sStateSpaceForecastalgorithm forecasts the latency band (falling back to the corepredictcommand when the toolkit's Python for Scientific Computing add-on is absent) andanomalydetectionflags statistically outlying buckets. The saturation onset is found by Splunk's ML, not by a fixed threshold in kassi, and the forecast band and anomalous buckets fold into the verdict. Non-blocking, like the other Splunk phases.analyzeis the writer phase: the model produces, from the recorded facts, a practical analysis (summary, affected endpoints, root cause, evidence with a source citation per fact, and a recommendation), grounded on the evidence documents so it stays to the measured numbers; and, in diff mode, a proposed remediation (a minimal unified diff that fixes the root cause, written from the diff that introduced it) for human review. Both fall back to deterministic text when the model is absent.screenis the auditor phase: a separate Granite Guardian 4.1 model judges whether the analysis is grounded in the evidence it cites (any claim unsupported by or contradicting the telemetry), and the pass/fail is sealed to the report. The writer is checked by a second model, not trusted on its own word. Non-blocking: skipped when Guardian is off.reportassembles the combined client plus server verdict and the tarot narration (one line per phase, deterministic omens when the model is absent). Every upstream tool call is logged tomcp_provenance. The run is published to Splunk twice over: akassi:runsummary, and the agent's own state-machine walk as onekassi:stepevent per phase (keyed by Burr'sapp_id), so the dashboard shows not just what the change did but how the agent reached the verdict. The model authors only the script, the analysis, the remediation, and the narration, never the SPL.
The Major Arcana
Each phase is a card the agent turns. Run kassi arcana for the full spread.
| Card | Phase | Omen |
|---|---|---|
| The Fool (0) | select_mode | the querent sets out: diff or intent |
| The High Priestess (II) | read_diff | hidden knowledge read from the diff |
| The Emperor (IV) | extract_endpoints | order from change: the routes are named |
| The Empress (III) | parse_intent | intuition reads the intent into endpoints |
| The Hierophant (V) | doc_lookup | doctrine consulted: the k6 docs ground the rite |
| The Chariot (VII) | scaffold | the vehicle is assembled from the spec: a runnable scaffold takes shape |
| The Magician (I) | generate_script | as above, so below: the agent authors the script atop the scaffold |
| Justice (XI) | validate_script | the script is weighed; the unworthy is turned back |
| Temperance (XIV) | fix_script | the flawed draft is tempered against k6's judgment until it holds |
| The Tower (XVI) | run_test | load strikes the structure; what breaks is revealed |
| The Hermit (IX) | splunk_preflight | a lantern into the index before the reading |
| The Lovers (VI) | correlate | client and server joined over one window |
| The Star (XVII) | detect_anomalies | Splunk's own forecast is cast; where the load breaches the band is revealed |
| The Sun (XIX) | analyze | the reading is made plain: cause, evidence, and the cure laid bare |
| The Hanged Man (XII) | screen | seen again through another's eyes: the reading is judged grounded, or not |
| Judgement (XX) | report | the verdict is spoken and sealed to the ledger |
| The World (XXI) | the ledger | the cycle closes: an immutable, hash-chained record |
| The Devil (XV) | a refusal | you are bound: only the legal moves are permitted |
Case study
Verified end-to-end against Splunk Enterprise 10.4.0 with the official Splunk MCP
Server (Splunkbase 7931, v1.2.0), called live at runtime. scripts/verify_petclinic.py
drives the whole FSM with nothing canned, in diff mode: a throwaway git repo holds a
healthy petclinic baseline plus a second commit that adds POST /api/visits, so kassi picks
the changed endpoint from the diff, runs real k6 through the k6 MCP server against it,
reads the server-side regression back from Splunk through the four correlate queries, and
runs the AI Toolkit's StateSpaceForecast (with predict as the fallback) plus
anomalydetection over the same window in detect_anomalies, all on the official
splunk_run_query tool.
$ KASSI_LLM=anthropic envchain ai uv run python scripts/verify_petclinic.py
target app:  petclinic (flawed POST /api/visits) at http://127.0.0.1:8400
diff mode:   HEAD~1..HEAD adds POST /api/visits         # kassi tests exactly the changed endpoint
... extract_endpoints_ok count=1                        # one new route, read from the diff
... validation failed (attempt 0): Unexpected token ILLEGAL ... Missing k6 module imports
... fix_script_done attempt=1                           # repaired from the real k6 error
... run_test_ok exit_code=0 reqs=2937
verdict:         server-side regression: /api/visits p95 318.44ms, 59.4% 5xx, cause 'database is locked'
endpoints:       POST /api/visits
k6 client-side:  2937 reqs, p95 318.44 ms, 59.4% failed
worst endpoint:  /api/visits  59.4% errs  p95 318.44 ms
root cause:      database is locked  (1797x)
anomaly scan:    splunk StateSpaceForecast + anomalydetection over 13 buckets, 1 anomalous bucket
mcp tool calls:  k6.{list_sections, get_documentation x4, generate_script(prompt),
                     validate_script x2, run_script}
                 splunk.{get_info, get_index_info, get_metadata, run_query x6}
the reading:
    🂠  The Fool: Diff mode revealed 1 endpoint under scrutiny.
    🂠  The Magician: Script authored, repaired once, validated successfully.
    🂠  The Tower: 2937 requests executed; p95 318.44 ms, 59.4% failure rate.
    🂠  The Lovers: /api/visits worst at 59.4% errors, database locked 1797 times.
    🂠  The Star: StateSpaceForecast forecast p95 ~312ms; anomalydetection flagged the anomalous bucket.
    🂠  Judgement: Server regression confirmed: /api/visits, database lock root cause.
What this proves, all at runtime against live Splunk: kassi read the new POST /api/visits
from the git diff (the healthy GET routes are untouched by the change, so it tests exactly
the new endpoint), the model authored a script that failed k6 validation, the fix_script
loop repaired it from the real k6 error and re-validated, real k6 drove 2937 requests, the
four correlate queries on the official Splunk MCP Server isolated the new endpoint
(/api/visits at 59.4% 5xx) and named the root cause k6 cannot see ("database is locked"),
and the AI Toolkit's StateSpaceForecast forecast the latency band while anomalydetection
flagged the anomalous bucket statistically.
Every upstream call is on the hash-chained ledger and in mcp_provenance. See
docs/SPLUNK_SETUP.md for the full setup.
For a lighter reproduction without a target app, scripts/verify_correlate_live.py cans the
k6 metrics and ingests sample telemetry, but still queries the real official Splunk MCP Server.
Demo scenarios
examples/ ships five target apps, each a healthy baseline plus one "new" endpoint with a
distinct load-induced failure, so the suite spans the common regression classes (not just one
trick). Each ships the same access_json telemetry to Splunk, so kassi correlates them
unchanged; the failure only appears under concurrency.
| App | New endpoint | Failure signature | What it exercises |
|---|---|---|---|
petclinic | POST /api/visits | 5xx, constant, database is locked | correlation isolates the root-cause error |
storefront | POST /api/checkout | latency, 0 errors (N+1 over a shared connection) | server-side db_time, invisible to the client error rate |
feed | POST /api/events | latency rising over the run (unbounded recompute) | detect_anomalies: the forecast band and anomalydetection catch the trend |
gateway | GET /api/quote | 4xx 429 throttling (too-tight rate limit) | client-vs-server error split: "throttled, not broken" |
orders | POST /api/order | latency + 504 mix (downstream cascade) | dependency root cause, resilience recommendation |
Run any of them end-to-end (starts the app, real k6, live Splunk, the grounded analysis):
uv run python scripts/verify_scenario.py feed # or petclinic | storefront | gateway | orders
petclinic is also the headline diff-mode run below.
Benchmark
kassi-bench scores kassi against ground truth: 80 live runs over five change-induced fault classes
(5xx regression, two latency degradations, 4xx throttling, a 504 cascade) plus three healthy
controls, ten reps each, deterministic load, scored on kassi's actual verdict. kassi is correct on
all 80: 100% detection, localization, failure-class, and root cause across the faults, and 0% false
alarms on the controls. The suite found and fixed two real verdict bugs along the way (a missing
throttling branch, a missing latency floor). Full methodology and the table:
docs/benchmark/BENCHMARK.md.
uv run python scripts/benchmark.py --reps 10     # writes docs/benchmark/results.json
uv run python scripts/benchmark_report.py        # regenerates the report
Dashboard
The report phase publishes each run to index=kassi_runs over HEC: a kassi:run summary
(verdict, k6 client metrics, the server-side correlation, the forecast, the root cause) and,
because the agent's own execution is telemetry too, one kassi:step event per state-machine
phase, the agent's walk from The Fool to Judgement, keyed by Burr's app_id. So the dashboard
shows both what the change did and how the agent reached the verdict. The agent stays CLI/MCP;
Splunk is the reporting surface. Provision it once:
uv run python scripts/setup_dashboard.py   # creates the index, an HEC token, and the dashboard
# paste the printed KASSI_HEC_TOKEN into .env, then every run self-publishes
The dashboard (docs/dashboard/kassi_overview.xml) shows the latest verdict, the agent's
state-machine walk for that run (each phase, its outcome, and the tool calls it made), step
outcomes across runs, k6 vs server-side p95, p95 across runs, server-side errors by endpoint,
and a run-history table. Gated on KASSI_HEC_TOKEN: with it unset, runs simply don't publish.
Development
uv run ruff format . && uv run ruff check .
uv run pytest
The tests use Theodosia's FakeUpstream for both MCP servers and a fake LLM, so
they run offline with no k6, Splunk, Ollama, or network.
Local Splunk
docs/SPLUNK_SETUP.md walks through running Splunk Enterprise
locally, seeding sample telemetry, and verifying the integration. The two helper scripts:
uv run python scripts/seed_splunk.py            # index + HEC + sample data + verify the SPL kassi emits
uv run python scripts/verify_correlate_live.py  # drive the whole FSM; correlate hits live Splunk
KASSI_LLM=anthropic envchain ai uv run python scripts/verify_petclinic.py  # the real-app root-cause demo
verify_petclinic.py is the headline demo, nothing canned: it starts the
examples/petclinic app (a healthy baseline plus a new
POST /api/visits with a SQLite write-lock flaw that only bites under load, shipping
access logs to Splunk's HEC), runs real k6 through the k6 MCP server, and reads the
server-side regression back from Splunk: which endpoint, how bad, and the "database is
locked" root cause k6 alone can't see.
scripts/dev_splunk_mcp.py is a local stdio MCP bridge to Splunk REST, used only to
exercise the correlate path without the official app. Production uses the official Splunk
MCP Server via KASSI_SPLUNK_MCP_ENDPOINT + KASSI_SPLUNK_TOKEN. See the Case
study for a verified run.
License
Apache-2.0. kassi builds on Theodosia (Apache-2.0), Burr (Apache-2.0), and the official Grafana k6 and Splunk MCP servers.