
claudit
kurofune/claudit
Auditoria de custos e atividades para agents Claude Code e Codex
Ver no GitHubAgent Go que audita sessões de coding agents (Claude Code e Codex), rastreando tokens gastos, custos em USD e atividades realizadas. Oferece dashboard web local que monitora logs `.jsonl` em tempo real, com visualizações de gasto por projeto, modelo, ferramenta e usuário.
Instalação
npx convez-ai kurofune/claudit1 comando no terminal: detecta o formato do repositório (marketplace ou plugin avulso) e instala via Claude Code. Requer Node 18+ e o Claude Code instalado.
Métricas
Casos de uso
- Monitorar gastos de tokens em sessões de coding agents
- Rastrear custo por projeto, modelo e ferramenta utilizada
- Analisar padrões de uso e otimizar orçamento de agents
- Debugar comportamento de agents com histórico detalhado de prompts e comandos
Veredito

Ferramenta essencial para quem executa agents Claude Code em produção. Oferece visibilidade operacional completa sobre custos e comportamentos, com interface web funcional e monitoramento em tempo real via CLI.
README
A tradução para o português deste README ainda está na fila.
claudit


Audit your coding-agent sessions (Claude Code and Codex) — what your agents actually did, and what it cost.
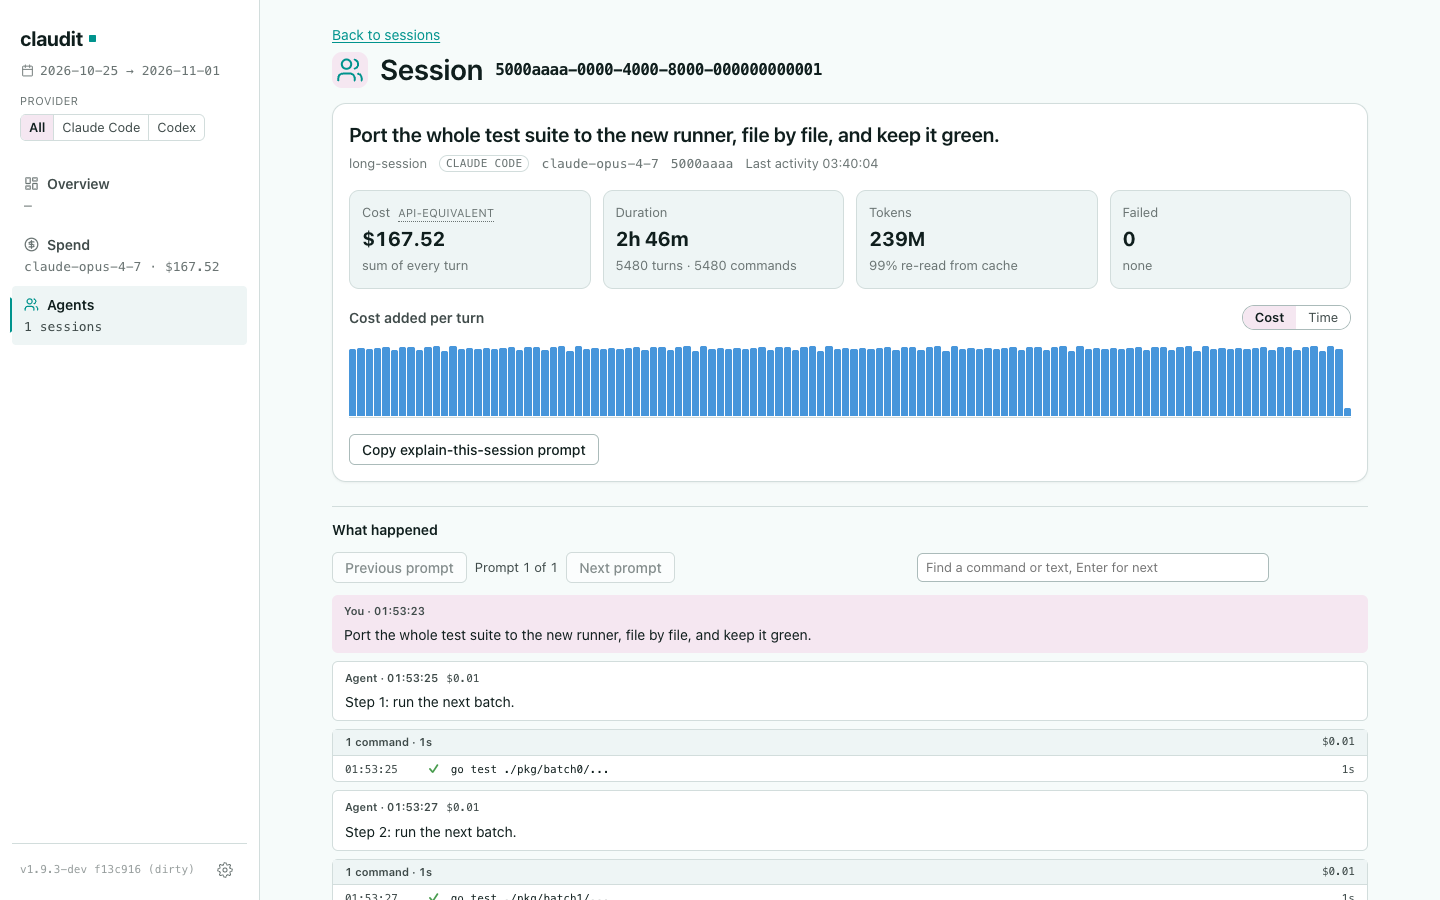
claudit is a local web app over the .jsonl session logs your coding agents write: Claude Code's under ~/.claude/projects/ (--root to override) and Codex's rollouts under $CODEX_HOME/sessions, else ~/.codex/sessions (--codex-root to override, or --codex-root="" to leave Codex out). Run claudit serve and open the dashboard in your browser: it re-reads the logs as new turns land and shows where the money went — by project, model, tool, subagent, and individual user prompt.
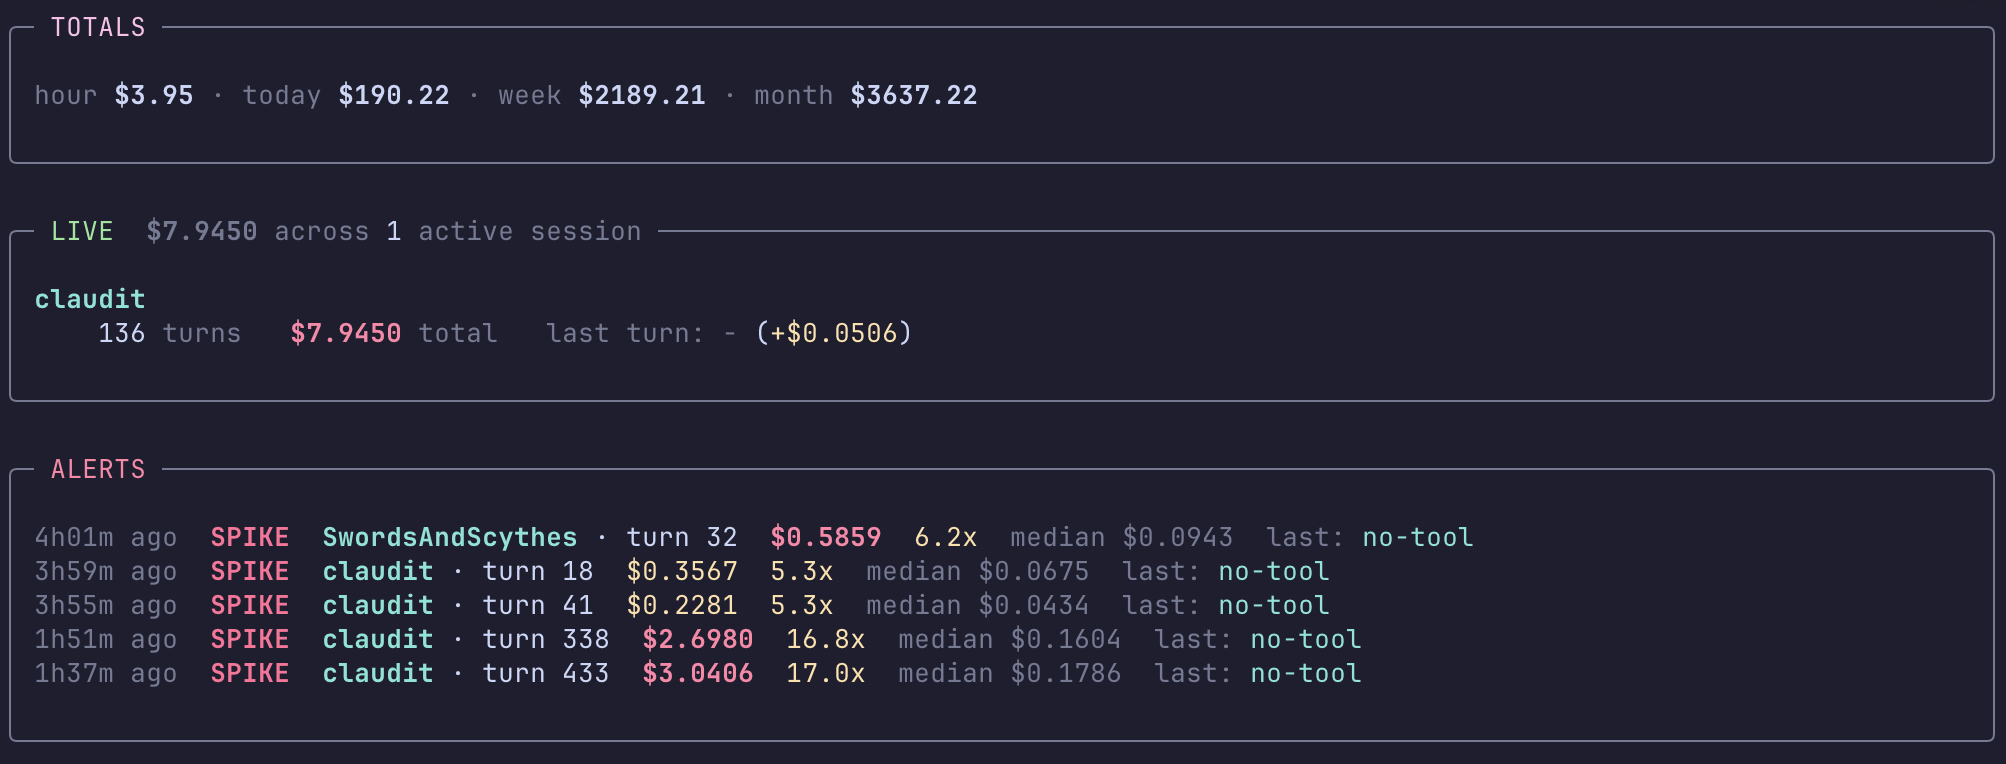
Its centrepiece is the Agents view: every session in the window, grouped by what it was asked to do, and for each one a page that reads like a CI log — every prompt, agent message, command and sub-agent, with the session's cost, failures and what is worth a look. See The Agents view. For a terminal, claudit watch tails a live session and shows its cost accruing.
Install
go install github.com/kurofune/claudit/v2/cmd/claudit@latest
Requires Go 1.26 or later. The binary lands in $GOBIN (usually ~/go/bin).
Quick start
# Run the local web daemon — auto-reloads as new turns land, filter via URL
claudit serve                         # http://127.0.0.1:8787 (bare `claudit` does the same)
claudit serve --port=9000 --open=false
# Filters live in the query string, views in the URL hash:
#   http://127.0.0.1:8787/?project=myrepo&last=7d
#   http://127.0.0.1:8787/?since=2026-05-01&until=2026-05-15&by=week#spend
#   http://127.0.0.1:8787/#spend/project/tokens   # Spend by project, in tokens
#   http://127.0.0.1:8787/#agents                 # the Sessions list
#   http://127.0.0.1:8787/#agents/<session-id>    # one session's page

# Tail the currently-running session and watch cost accrue
claudit watch --budget=5.00

# Or tail every recently-modified session under ~/.claude/projects, grouped by project
claudit watch --all
Run claudit help for the subcommand list and claudit <cmd> --help for per-command flags.
Date filters (serve's ?since / ?until) are calendar dates interpreted at midnight in your local time zone — consistent with ?last and the watch rolling totals.
What it shows
- Overview. Turns, sessions, tokens (input / output / cache-read / 5m-cache-write / 1h-cache-write), cost in USD, cache hit ratio, and the time range covered.
- Spend. One view with a Dollars / Tokens toggle, split by model, project, subagent, skill and slash command, and top prompts, with trend charts. Projects are grouped by git repo root, so a repo's worktrees and subdirectories roll up into one row.
- Tools. Under the Overview's hotspots, Show all tool patterns opens one sortable table of every tool (Bash, Read, Edit, Grep, WebFetch, Skill, Agent, …) with its argument patterns beneath — Bash commands, file extensions read, grep globs, web hosts fetched — on calls, error %, median and p95 duration, context added and context cost, including the zero-cost rows and the tools the hotspot list leaves out.
#overview/alllinks straight to it. - Subagent attribution. Sidechain (subagent) cost separated from main-thread cost, with per-invocation rows and per-agent-type roll-ups.
- Per-prompt cost. Every user prompt's downstream cost, computed by walking the conversation's parent links (Spend → By top prompts).
- Hotspots. Top cost drivers with a copyable LLM prompt for each, so you can paste the prompt into a model and get specific advice on that exact driver.
- Agents. The Agents view is the Sessions surface: a list of every session grouped by prompt family, and per session a header (cost, duration, tokens, unresolved failures, a per-turn cost or time strip and up to three Worth a look notes) above its story — each prompt, agent message and command with its exact input and output, and every sub-agent nested where it was spawned. See The Agents view.
- Trends and anomalies. Day/week/month buckets; buckets with abnormal cost spikes or cache hit-ratio drops are flagged inline on the chart.
The Agents view
The Agents tab turns the raw transcript into something you can read and audit — not just "where did the money go," but "what did the agent do." Open it at http://127.0.0.1:8787/#agents. It has three parts:
- List — every session in the window, grouped by prompt family (the first line of its first real prompt, with bead ids, paths, hashes and numbers blanked), each row naming what set it apart, the agent's last line, provider, cost, duration and unresolved failures. Search, the All / Active in the last minute / Had unresolved failures chips and the Newest / Cost / Duration sorts narrow it; sessions active in the last minute pin to the top. Arrow keys and Enter open a session.
- Header — the session's cost (API-equivalent), duration with its turn and command counts, tokens with the share re-read from cache, and its unresolved failures; a strip of one bar per turn sized by what it added to context or by its duration; up to three Worth a look notes from the retry-storm, cost-whale, slow-tool, error-cascade and idle-stall detectors; and a button that copies a prompt asking the agent that ran the session to explain it.
- Story — "What happened", one user prompt at a time: the prompt and each agent message verbatim, each message's commands under a counted header, one row per call (time, ✓ / ✕, command, duration) that expands to the exact input, output and the turn's reasoning, idle gaps, and sub-agents nested under the call that spawned them. Show full reads the untruncated text back from the session log.
#agents/<session-id> opens a session's page and #agents/<session-id>/<turn-uuid> lands on one turn. Prompt and tool-I/O content is shown in full — see Privacy.
Privacy
claudit runs entirely on your machine:
- It reads
.jsonlfiles already on disk (the ones Claude Code wrote there). - It reads a local pricing YAML.
claudit servebinds127.0.0.1by default, so only your own machine can reach the dashboard. It has no authentication;--bind=0.0.0.0exposes it to your LAN, at your own risk.
No session data leaves the machine: claudit makes no network calls and writes no report files. The one external request is the dashboard's typography — the browser loads Inter from Google Fonts, so your IP and User-Agent reach fonts.googleapis.com, but none of your prompts, paths, or costs do. Offline, it falls back to system sans-serif. Hotspot prompts are copyable text — pasting them into a model is your decision.
The dashboard shows your prompt text and tool input/output in full. Keep that in mind before screen-sharing it or exposing the port beyond loopback.
Pricing config
claudit ships with bundled default prices embedded in the binary, refreshed each release against Anthropic's pricing page. You don't need to do anything for those to take effect — upgrade and the new rates apply.
If you have custom rates (enterprise discounts, private-preview models, or a stopgap entry for a model the next release hasn't shipped yet), create ~/.config/claudit/prices.yaml. Entries there overlay the bundled defaults per-model: any model you define replaces the bundled entry for that name, and bundled entries you didn't touch stay intact. The file is per-million-token USD rates:
models:
  claude-opus-4-7:
    input_per_mtok: 15.00
    output_per_mtok: 75.00
    cache_read_per_mtok: 1.50
    cache_write_5m_per_mtok: 18.75
    cache_write_1h_per_mtok: 30.00
Prices are keyed by provider, then model. The bare top-level models: map above is Claude Code's; to price another provider's models, list them under providers: — an entry replaces the bundled one for that (provider, model) pair, or adds it:
providers:
  codex:
    models:
      gpt-6:
        input_per_mtok: 1.25
        output_per_mtok: 10.00
providers: {claude-code: {models: …}} is the same as the bare form. Override the path with --prices=path/to/file.yaml. Models that appear in your sessions but are missing from both the bundle and your overlay show up in the report's unknown_models block, named provider/model (e.g. claude-code/claude-future-9), with zero attributed cost — and claudit prints the turn count and token volume behind each one on stderr, so you can tell whether the gap is worth fixing. Add them to your YAML to get them priced.
Fast-mode rates
When a turn carries message.usage.speed: "fast", claudit uses the model's
optional fast: block. It accepts the same five per-million-token USD fields:
models:
  claude-opus-5-5:
    input_per_mtok: 4.00
    output_per_mtok: 20.00
    cache_read_per_mtok: 0.20
    cache_write_5m_per_mtok: 5.00
    cache_write_1h_per_mtok: 8.00
    fast:
      input_per_mtok: 8.00
      output_per_mtok: 40.00
      cache_read_per_mtok: 0.40
      cache_write_5m_per_mtok: 10.00
      cache_write_1h_per_mtok: 16.00
Standard, missing, or unrecognized speeds use the standard rate. Fast turns
also use the standard rate when the model has no fast: block. The fast block
is a flat current rate; rates: history applies only to standard pricing.
Overlays replace the entire model, including fast: and rates:; omitting
fast: in an override removes that model's bundled fast rates.
Long-prompt rates
Some models charge more for long prompts. An optional long_prompt: block
holds threshold_tokens plus the same five per-million-token USD fields. When
a standard-speed turn's prompt (input + cache reads + cache writes) is over the
threshold, every token in that turn, output included, prices at the block's
rates. Output tokens never count toward the threshold. Each turn is checked on
its own, and fast mode wins over the tier. Bundled Haiku 5.5 uses it:
models:
  claude-haiku-5-5:
    input_per_mtok: 0.10
    output_per_mtok: 0.50
    cache_read_per_mtok: 0.01
    cache_write_5m_per_mtok: 0.125
    cache_write_1h_per_mtok: 0.20
    long_prompt:
      threshold_tokens: 100000
      input_per_mtok: 0.50
      output_per_mtok: 2.50
      cache_read_per_mtok: 0.05
      cache_write_5m_per_mtok: 0.625
      cache_write_1h_per_mtok: 1.00
Like fast:, the tier is a flat current rate, and an overlay that omits
long_prompt: removes the model's bundled tier.
Rates that change over time
claudit prices historical sessions, so a rate change isn't a simple edit: bump the number and old turns re-price at rates that were never charged; leave it and new turns are wrong. A model's top-level fields are therefore the rate in effect now, and an optional rates: list holds what came before:
models:
  some-model:                     # illustrative — a model whose rate was cut
    input_per_mtok: 2.00          # in effect now
    output_per_mtok: 10.00
    cache_read_per_mtok: 0.20
    cache_write_5m_per_mtok: 2.50
    cache_write_1h_per_mtok: 4.00
    rates:
      - until: 2026-08-31         # inclusive — the old, higher rate
        input_per_mtok: 3.00
        output_per_mtok: 15.00
        cache_read_per_mtok: 0.30
        cache_write_5m_per_mtok: 3.75
        cache_write_1h_per_mtok: 6.00
No bundled model currently carries a rates: list — Sonnet 5's introductory
window did until the increase it preceded was cancelled — so the mechanism is
there for the next real rate change and for your own overlay.
Each turn is priced at the rate in effect when it ran. until is inclusive and interpreted in UTC — the period covers everything through 23:59:59 on that date. Periods may be listed in any order; claudit picks the narrowest one covering the turn. A turn with no usable timestamp prices at the current (top-level) rate.
The rates: key is optional and purely additive — an overlay written in the flat form keeps working unchanged. Overlay semantics are unchanged too: defining a model replaces the bundled entry entirely, rate history included, so a flat override makes your rate apply at every timestamp.
Subcommands
| Command | Purpose |
|---|---|
serve | Run the local web daemon: a live dashboard that re-reads the JSONLs as they change and hosts the Agents Sessions surface. Default when no subcommand is given. |
watch | Tail the active session (or every recently-modified session with --all) in a full-screen TUI, with rolling hour/today/week/month totals, spike detection, and budget alerts. |
version | Print the installed claudit version (also --version). |
claudit help shows the subcommand list; claudit <cmd> --help shows per-command flags.
Status and limitations
- The JSONL schema is Claude Code's. If Anthropic changes it, the parser may need to catch up.
- Prices are manually maintained in
prices.yaml. When Anthropic publishes new rates, you update the YAML. - Developed and dogfooded on macOS. CI runs the test suite on Linux, macOS, and Windows. On Windows,
claudit watch's live status line uses ANSI escape sequences — Windows Terminal and PowerShell 7 render them correctly; legacycmd.exewill show the escapes literally. - Desktop browsers only; the dashboard has no mobile layout.
License
MIT — see LICENSE.