
Geospatial Map Skill
henriod/geospatial-map-skill
Scaffolding de mapas interativos com padrões abertos e dados verificados
Ver no GitHubUma Skill para Claude Code que constrói mapas web interativos padrão-compliant usando MapLibre GL JS, com fontes de dados verificadas e paletas seguras para daltônicos. Inclui exemplo pronto de mapa de protestos Gen Z no Quênia, demonstrando boas práticas em engenharia geoespacial.
Instalação
npx convez-ai henriod/geospatial-map-skill1 comando no terminal: detecta o formato do repositório (marketplace ou plugin avulso) e instala via Claude Code. Requer Node 18+ e o Claude Code instalado.
Métricas
Casos de uso
- Criar visualizações geoespaciais interativas para análise de protestos ou movimentos sociais
- Gerar mapas de intensidade/densidade para dados geolalizados
- Prototipar dashboards de monitoramento geográfico com compliance a padrões abertos
Veredito

Skill sólida e bem documentada que aborda lacuna real: mapas corretos sem Mapbox proprietary. O exemplo do Quênia é legítimo e o checklist de auditoria é útil. Recomendado para quem precisa de geospatial sério, com dados verificados.
README
A tradução para o português deste README ainda está na fila.
geospatial-map-skill
A Claude Code Skill that scaffolds standards-compliant interactive web maps — and a worked example that builds a map of Kenya's Gen Z demonstration hotspots from June 2024 to the present.
The skill, map-init, encodes open-source-first geospatial engineering standards so that every map you scaffold uses the right stack, the right coordinate reference systems, and verified data sources by default — no Mapbox tokens, no fabricated coordinates, no rainbow ramps.
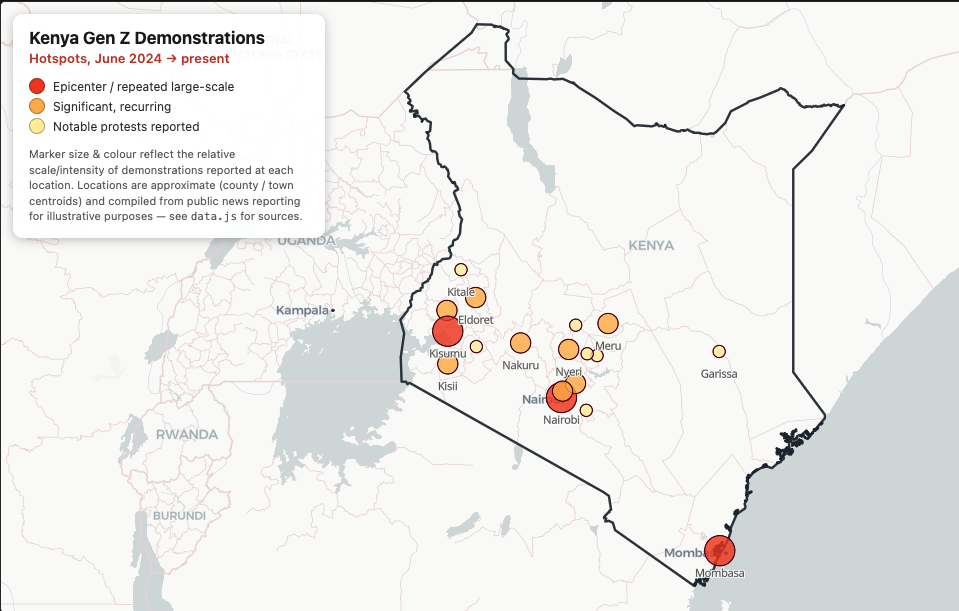
The example map: Gen Z demonstration hotspots across Kenya, sized and coloured by reported intensity. Built entirely by the
map-initskill.
What's in here
.
├── skill/
│   └── map-init/
│       └── SKILL.md                  ← the reusable Claude Code skill
├── examples/
│   └── kenya-genz-protests/          ← a complete map built with the skill
│       ├── index.html
│       ├── map.js
│       ├── data.js                   ← GeoJSON hotspots (provenance documented)
│       ├── kenya.geojson             ← verified ADM0 boundary (geoBoundaries)
│       └── style.css
├── docs/
│   └── walkthrough.md                ← step-by-step blog/tutorial
├── LICENSE
└── README.md
What the skill does
When you type /map-init <description>, Claude scaffolds a runnable web map following these defaults:
| Concern | Default | Why |
|---|---|---|
| Library | MapLibre GL JS | Open source, no access token (never Mapbox unless asked) |
| Basemap | CARTO Positron | Clean open vector style |
| Data CRS | EPSG:4326 [lng, lat] | RFC 7946 GeoJSON standard |
| Render CRS | EPSG:3857 | Web-map standard (handled by MapLibre) |
| Geometry | GADM / HDX / OSM / geoBoundaries | Never invent coordinates as fake "sample data" |
| Cartography | Colourblind-safe palettes, attribution, visual hierarchy | No rainbow schemes, no 3D clutter |
It also ships a decision checklist so the output can be audited — you can literally ask Claude "is this up to skill?" and get a compliance report.
Quick start
1. Install the skill
Copy the skill into your project's (or your global) Claude Code skills directory:
# project-local (this repo / project only)
mkdir -p .claude/skills
cp -R skill/map-init .claude/skills/

# — or — globally, for every project
mkdir -p ~/.claude/skills
cp -R skill/map-init ~/.claude/skills/
Claude Code discovers skills in .claude/skills/ automatically — no restart needed.
2. Use it
Open Claude Code in your project and run the slash command with a description:
/map-init map of protest hotspots in kenya since june 2024
Claude scaffolds index.html, map.js, data.js, and style.css, then serves the map and reports the local URL.
3. Run the included example
No Claude Code required to view the finished demo:
cd examples/kenya-genz-protests
python3 -m http.server 8000
# open http://localhost:8000/index.html
You get a map of Kenya with a dark national boundary and circle markers sized/coloured by protest intensity. Click any marker for that town's protest timeline.
About the example data
The Kenya example is illustrative, not analysis-grade, and says so explicitly in data.js:
- Coordinates — town/county centroids (verifiable via GeoNames), not exact protest sites.
- Events — compiled from public news reporting (Reuters, BBC, Nation, etc.).
- Intensity (
level1–3) — subjective editorial coding, not a verified turnout/fatality index. - Upgrade path — swap in ACLED Kenya event points for accurate coordinates, dates, and counts.
- Boundary — Kenya ADM0 from geoBoundaries (gbOpen, CC BY 4.0).
This honesty about provenance is a core rule of the skill, not an afterthought.
Read the walkthrough
docs/walkthrough.md tells the full story: setting up the skill, generating the map, auditing it against the standards, migrating Leaflet → MapLibre, and adding the verified boundary.
License & attribution
- Code & skill: MIT.
examples/kenya-genz-protests/kenya.geojson: © geoBoundaries, licensed CC BY 4.0 — attribution retained in the map and here.- Basemap © CARTO & © OpenStreetMap contributors.