
Coding Agent Visualizer
everettjf/coding-agent-visualizer
Visualize execuções de agentes de código com grafos, spans e análise de custos
Ver no GitHubFerramenta que transforma os logs JSONL gerados por agentes de código (Claude Code, OpenAI Codex) em visualizações interativas e analíticas. Exibe grafos de execução, waterfalls de spans, flame graphs de tokens, heatmaps de arquivos e dashboards de custos — tudo rodando localmente sem enviar dados para nuvem.
Instalação
npx convez-ai everettjf/coding-agent-visualizer1 comando no terminal: detecta o formato do repositório (marketplace ou plugin avulso) e instala via Claude Code. Requer Node 18+ e o Claude Code instalado.
Métricas
Casos de uso
- Debugar e entender o fluxo de execução de agentes de IA
- Analisar custos de token por sessão e modelo
- Rastrear quais arquivos foram modificados e com que frequência
- Comparar performance e padrões entre múltiplas execuções de agentes
Veredito

Solução técnica madura e bem-executada para observabilidade de agentes de código. Preenche uma lacuna real: dados brutos de JSONL viram insights visuais acionáveis. Stack moderno (React 19, React Flow, D3) e abordagem local-first inspiram confiança.
README
A tradução para o português deste README ainda está na fila.
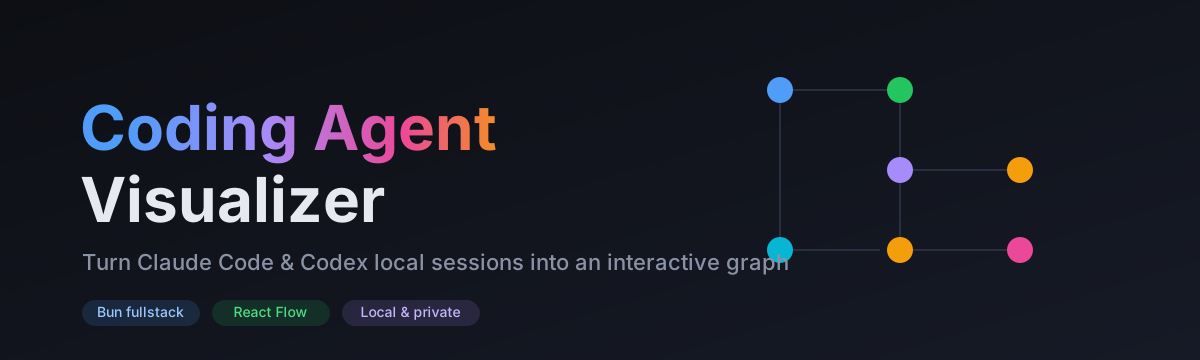
Coding Agent Visualizer
Turn the local session files of your coding agents into a beautiful, interactive map.


Coding agents like Claude Code and OpenAI Codex quietly record every session to disk as JSONL — messages, reasoning, tool calls, file edits and token usage. That data is a goldmine, but it lives in raw log files no one reads.
Coding Agent Visualizer reads those local files and renders them as an interactive execution graph, a distributed-tracing span waterfall, a token-cost flame graph, a file heatmap and an analytics dashboard — so you can actually see what your agent did, how it branched into sub-agents, which files it hammered, and where the tokens went.
No office mascots, no 3D robots. Just a fast, good-looking, useful lens on real agent runs. Everything runs locally — your transcripts never leave your machine.
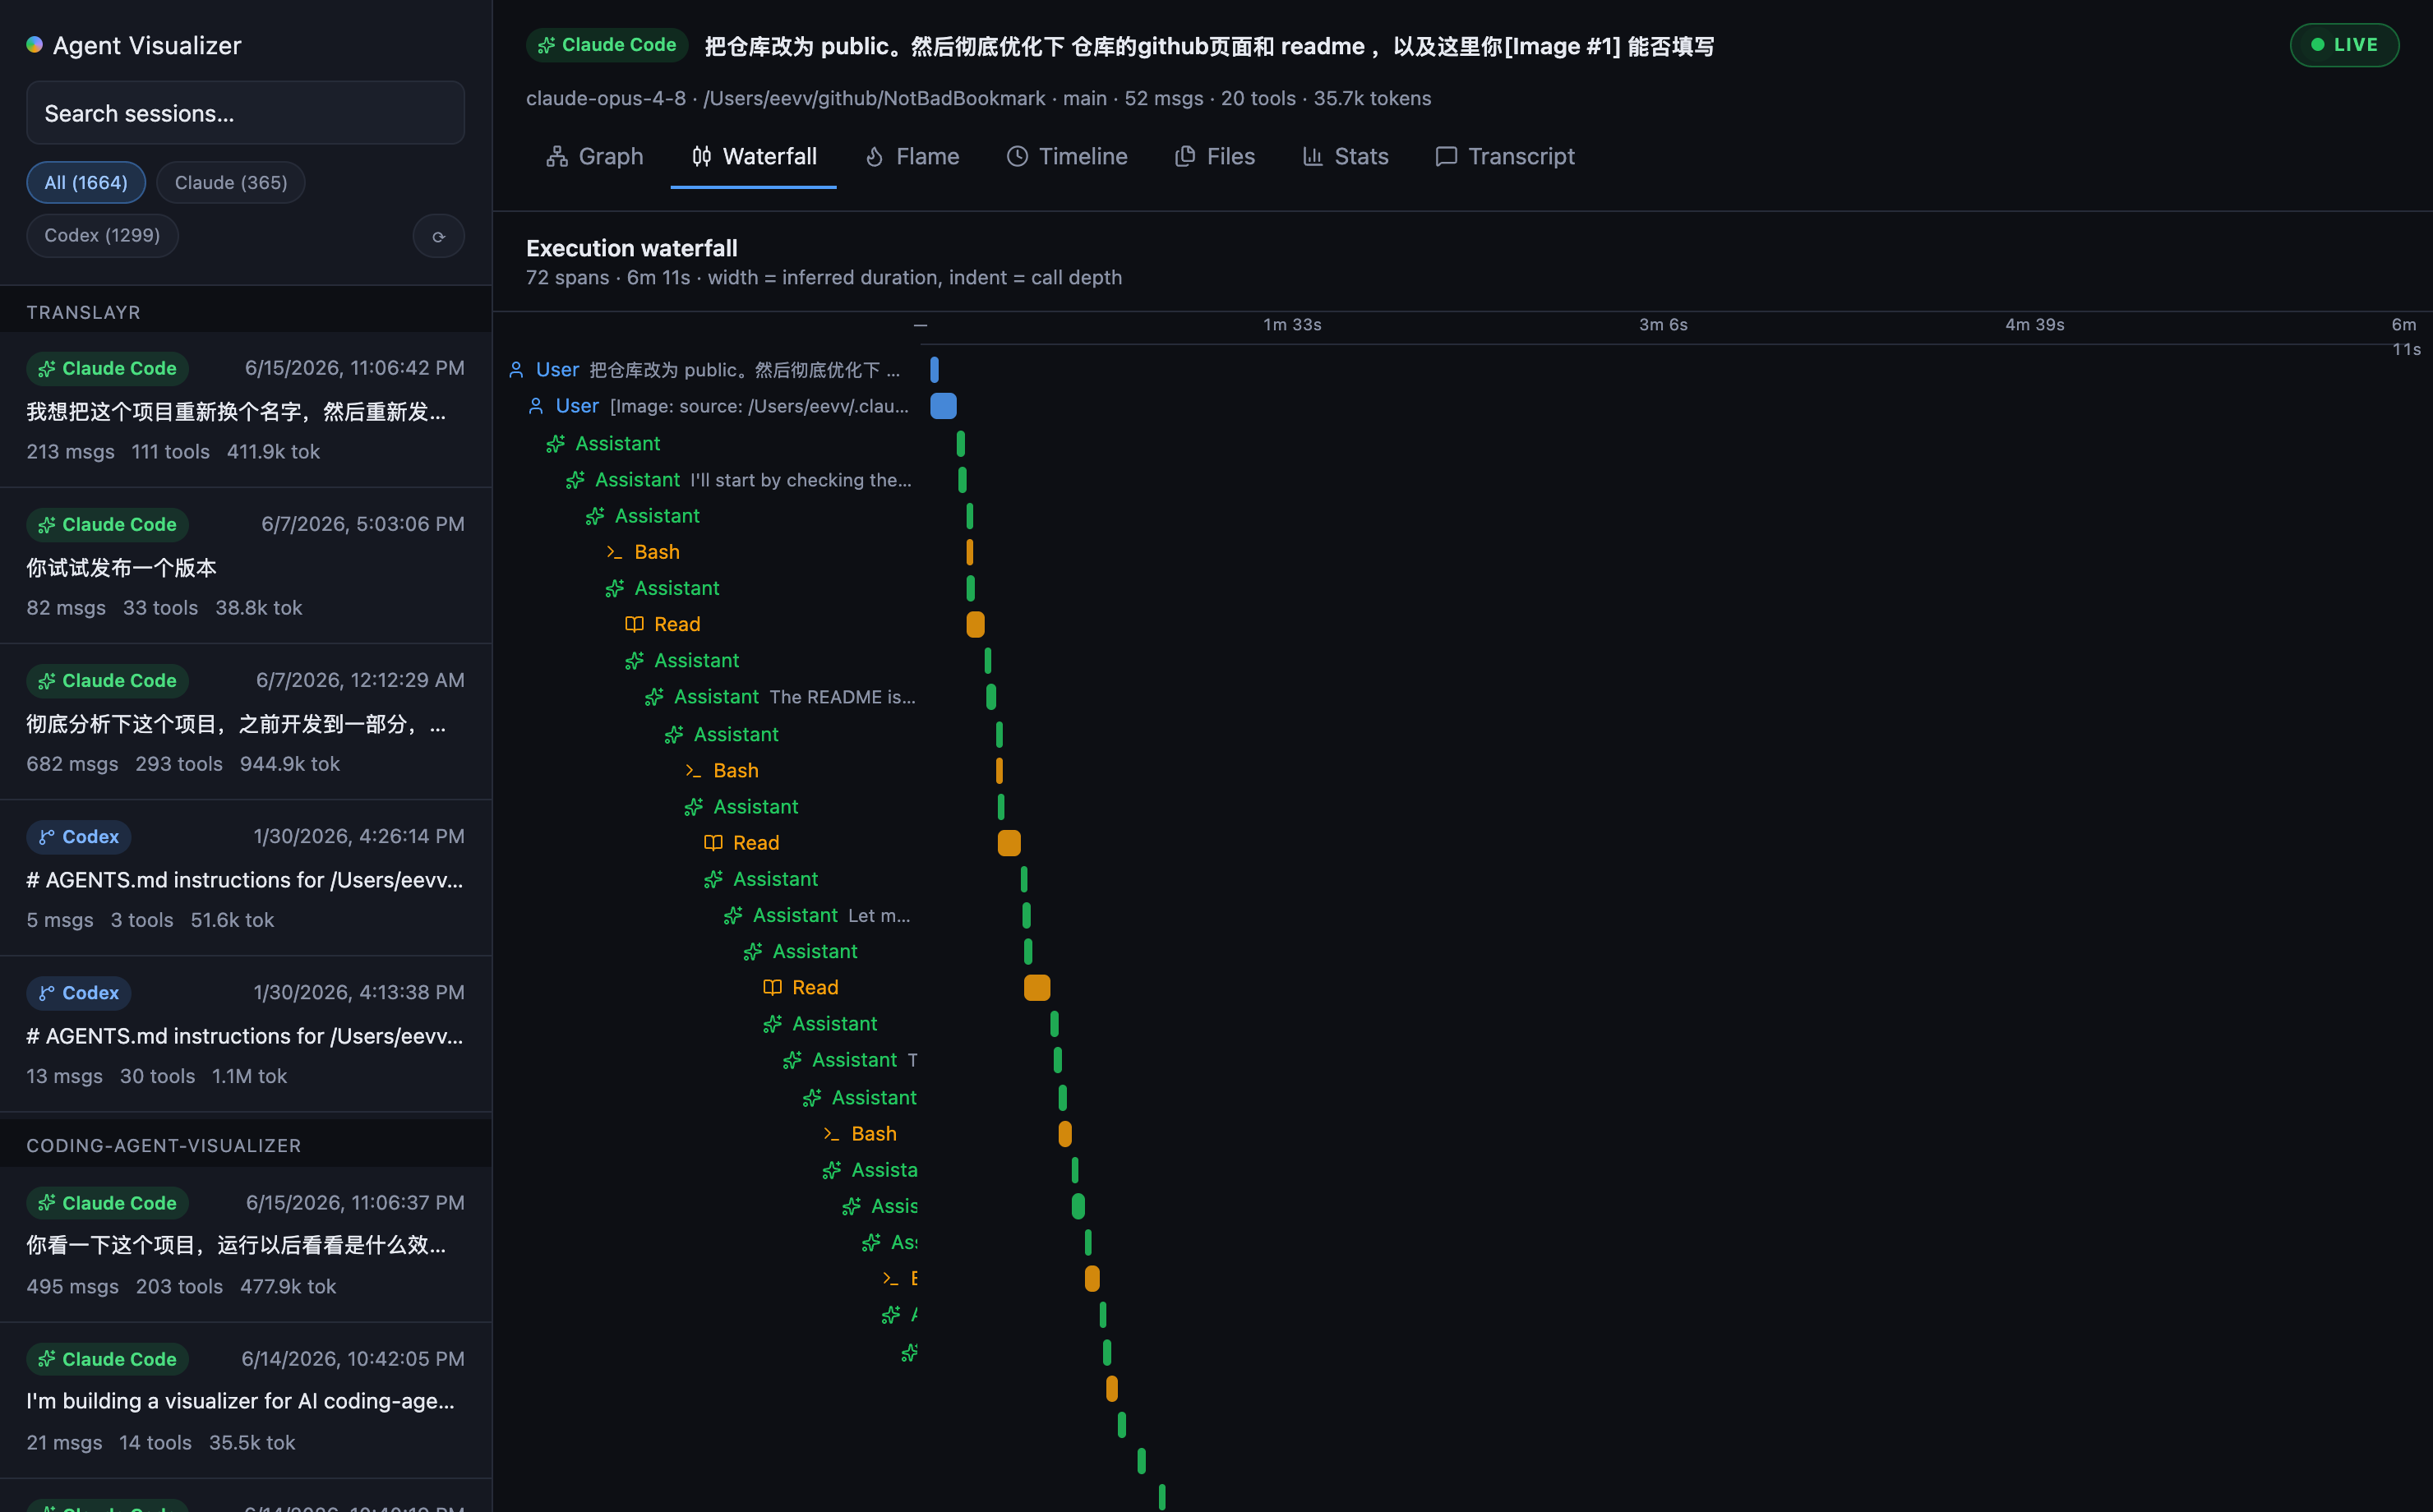
Span waterfall — every event as a span, indented by call depth
| Execution graph | Token-cost flame | Analytics |
|---|---|---|
 |  |  |
✨ Features
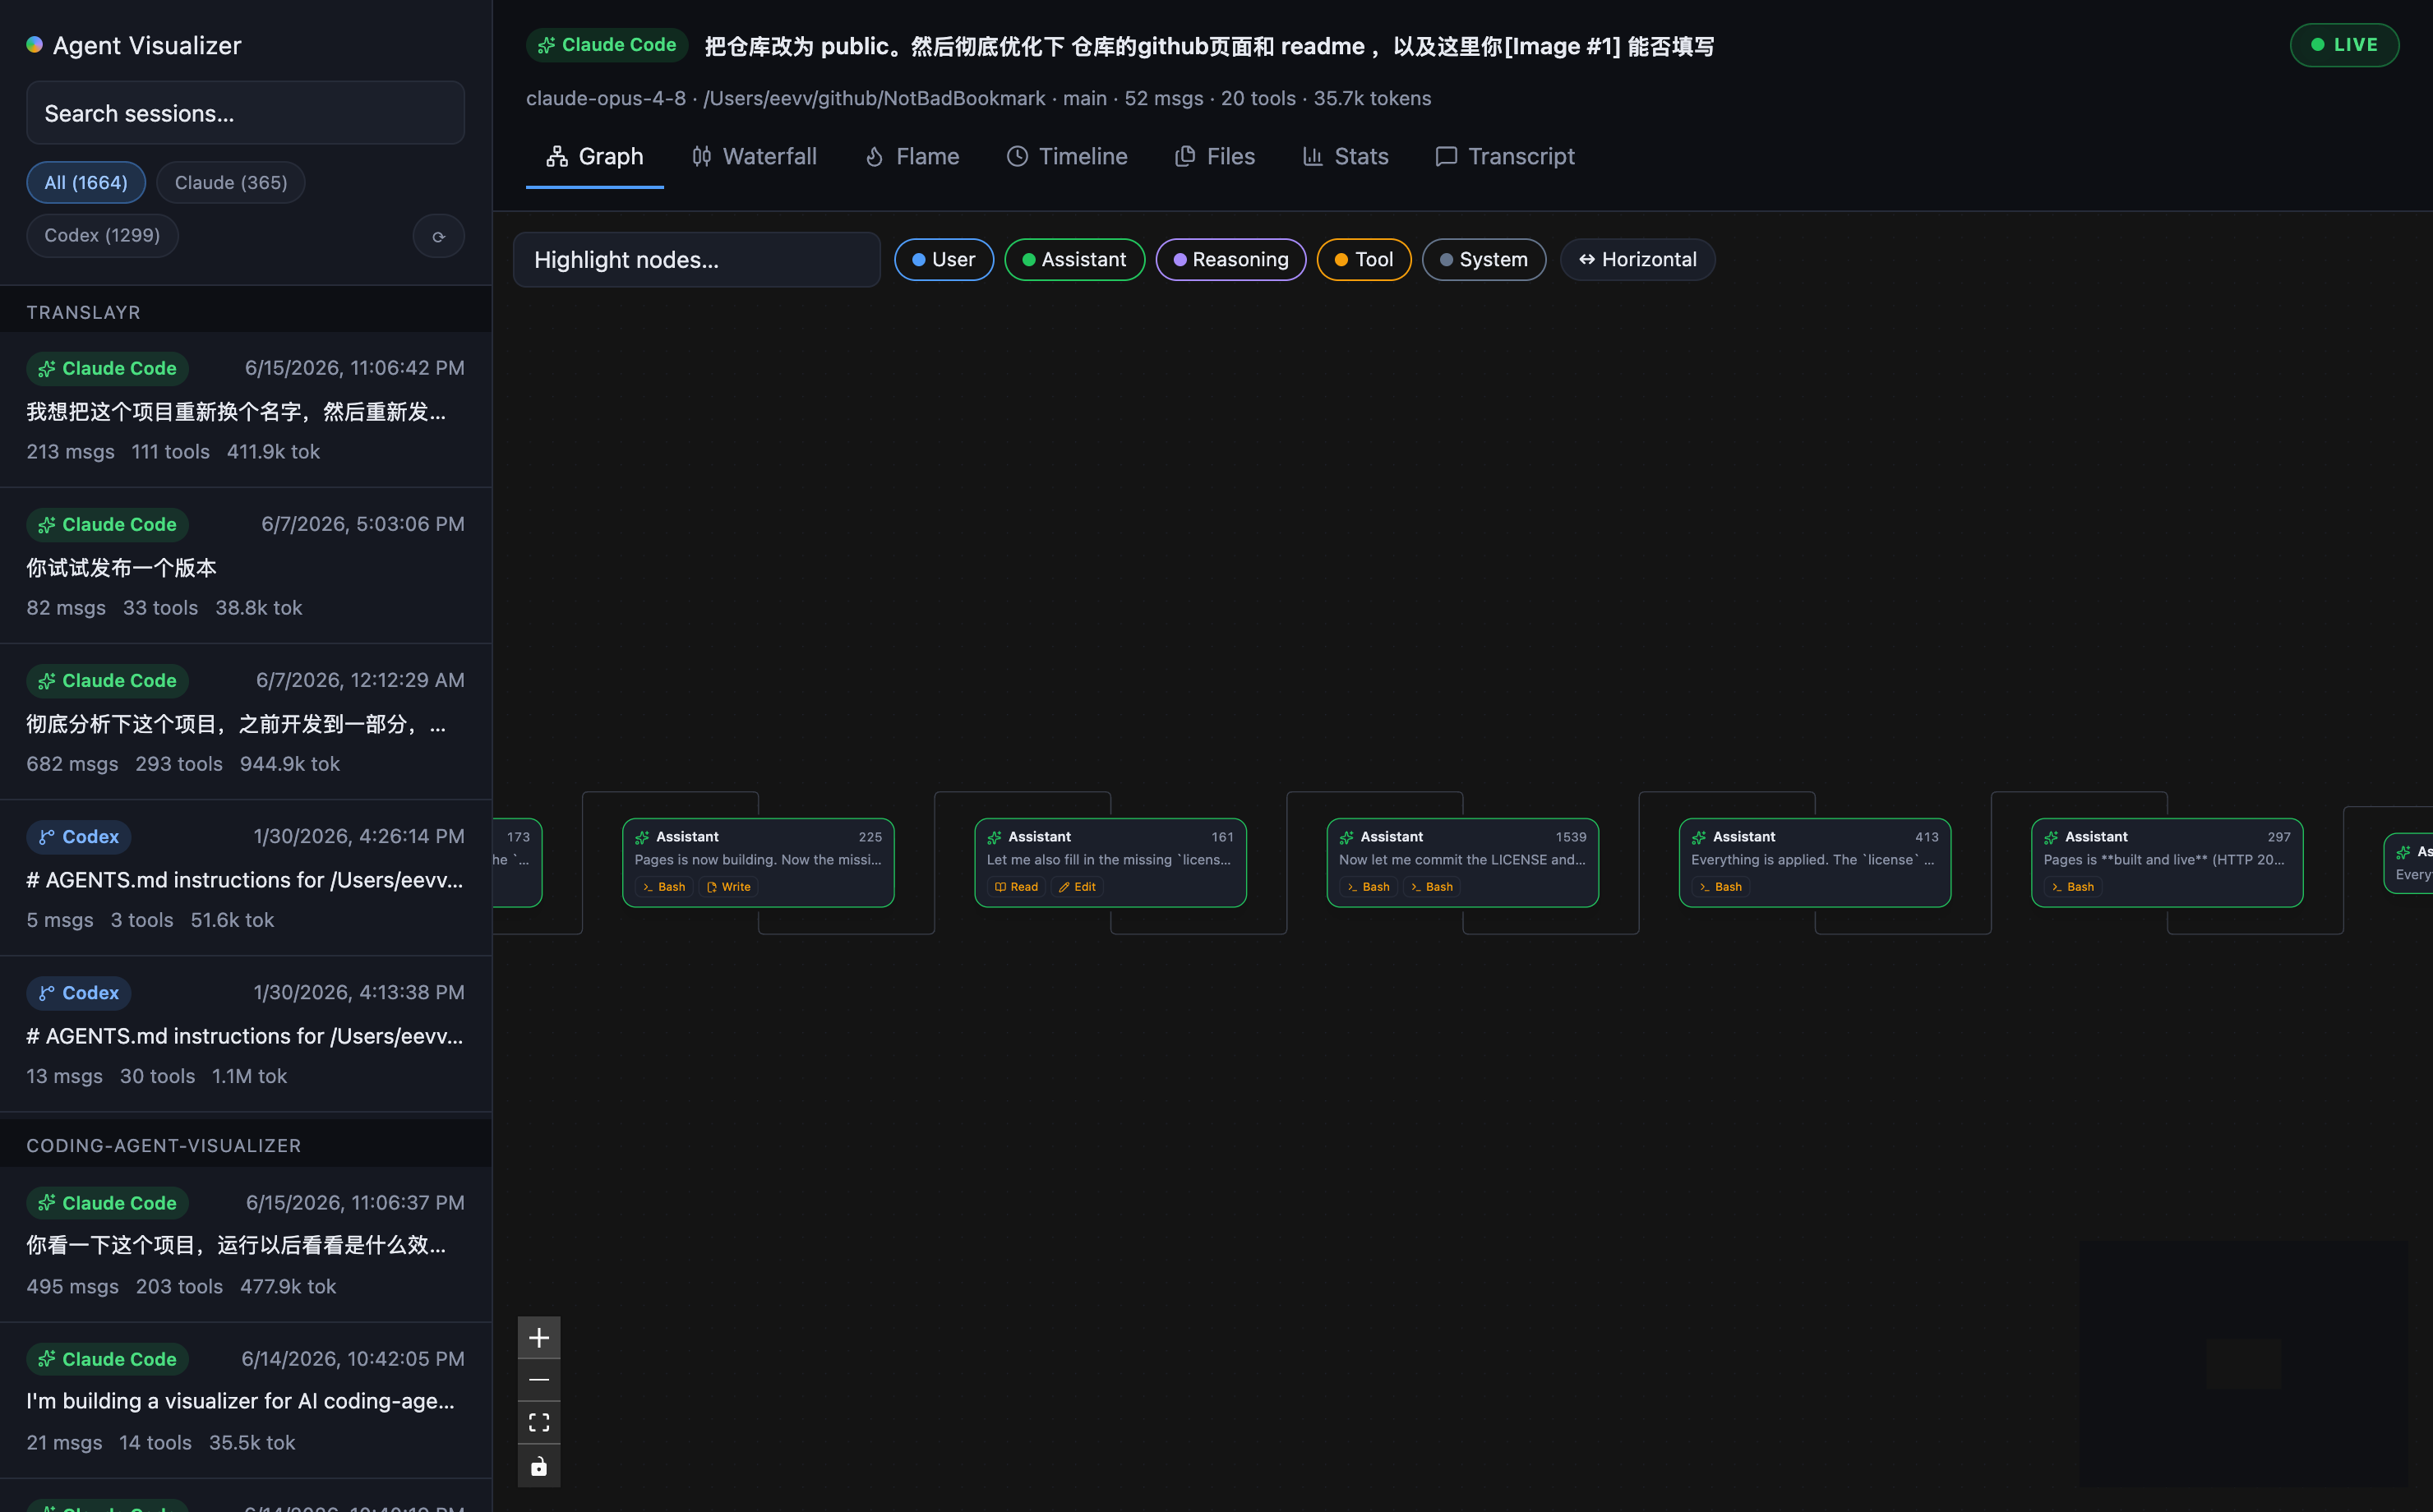
| 🕸️ Execution graph | Conversation rebuilt as a graph and laid out left-to-right with dagre. Tool-only turns fold into chips, fragments reconnect into one spine, sub-agents branch off — a readable flow instead of an endless staircase. |
| 🌊 Span waterfall | The distributed-tracing view (à la Jaeger / LangSmith / Phoenix): every event is a span, indented by call depth, positioned on a shared time axis, width = inferred duration. |
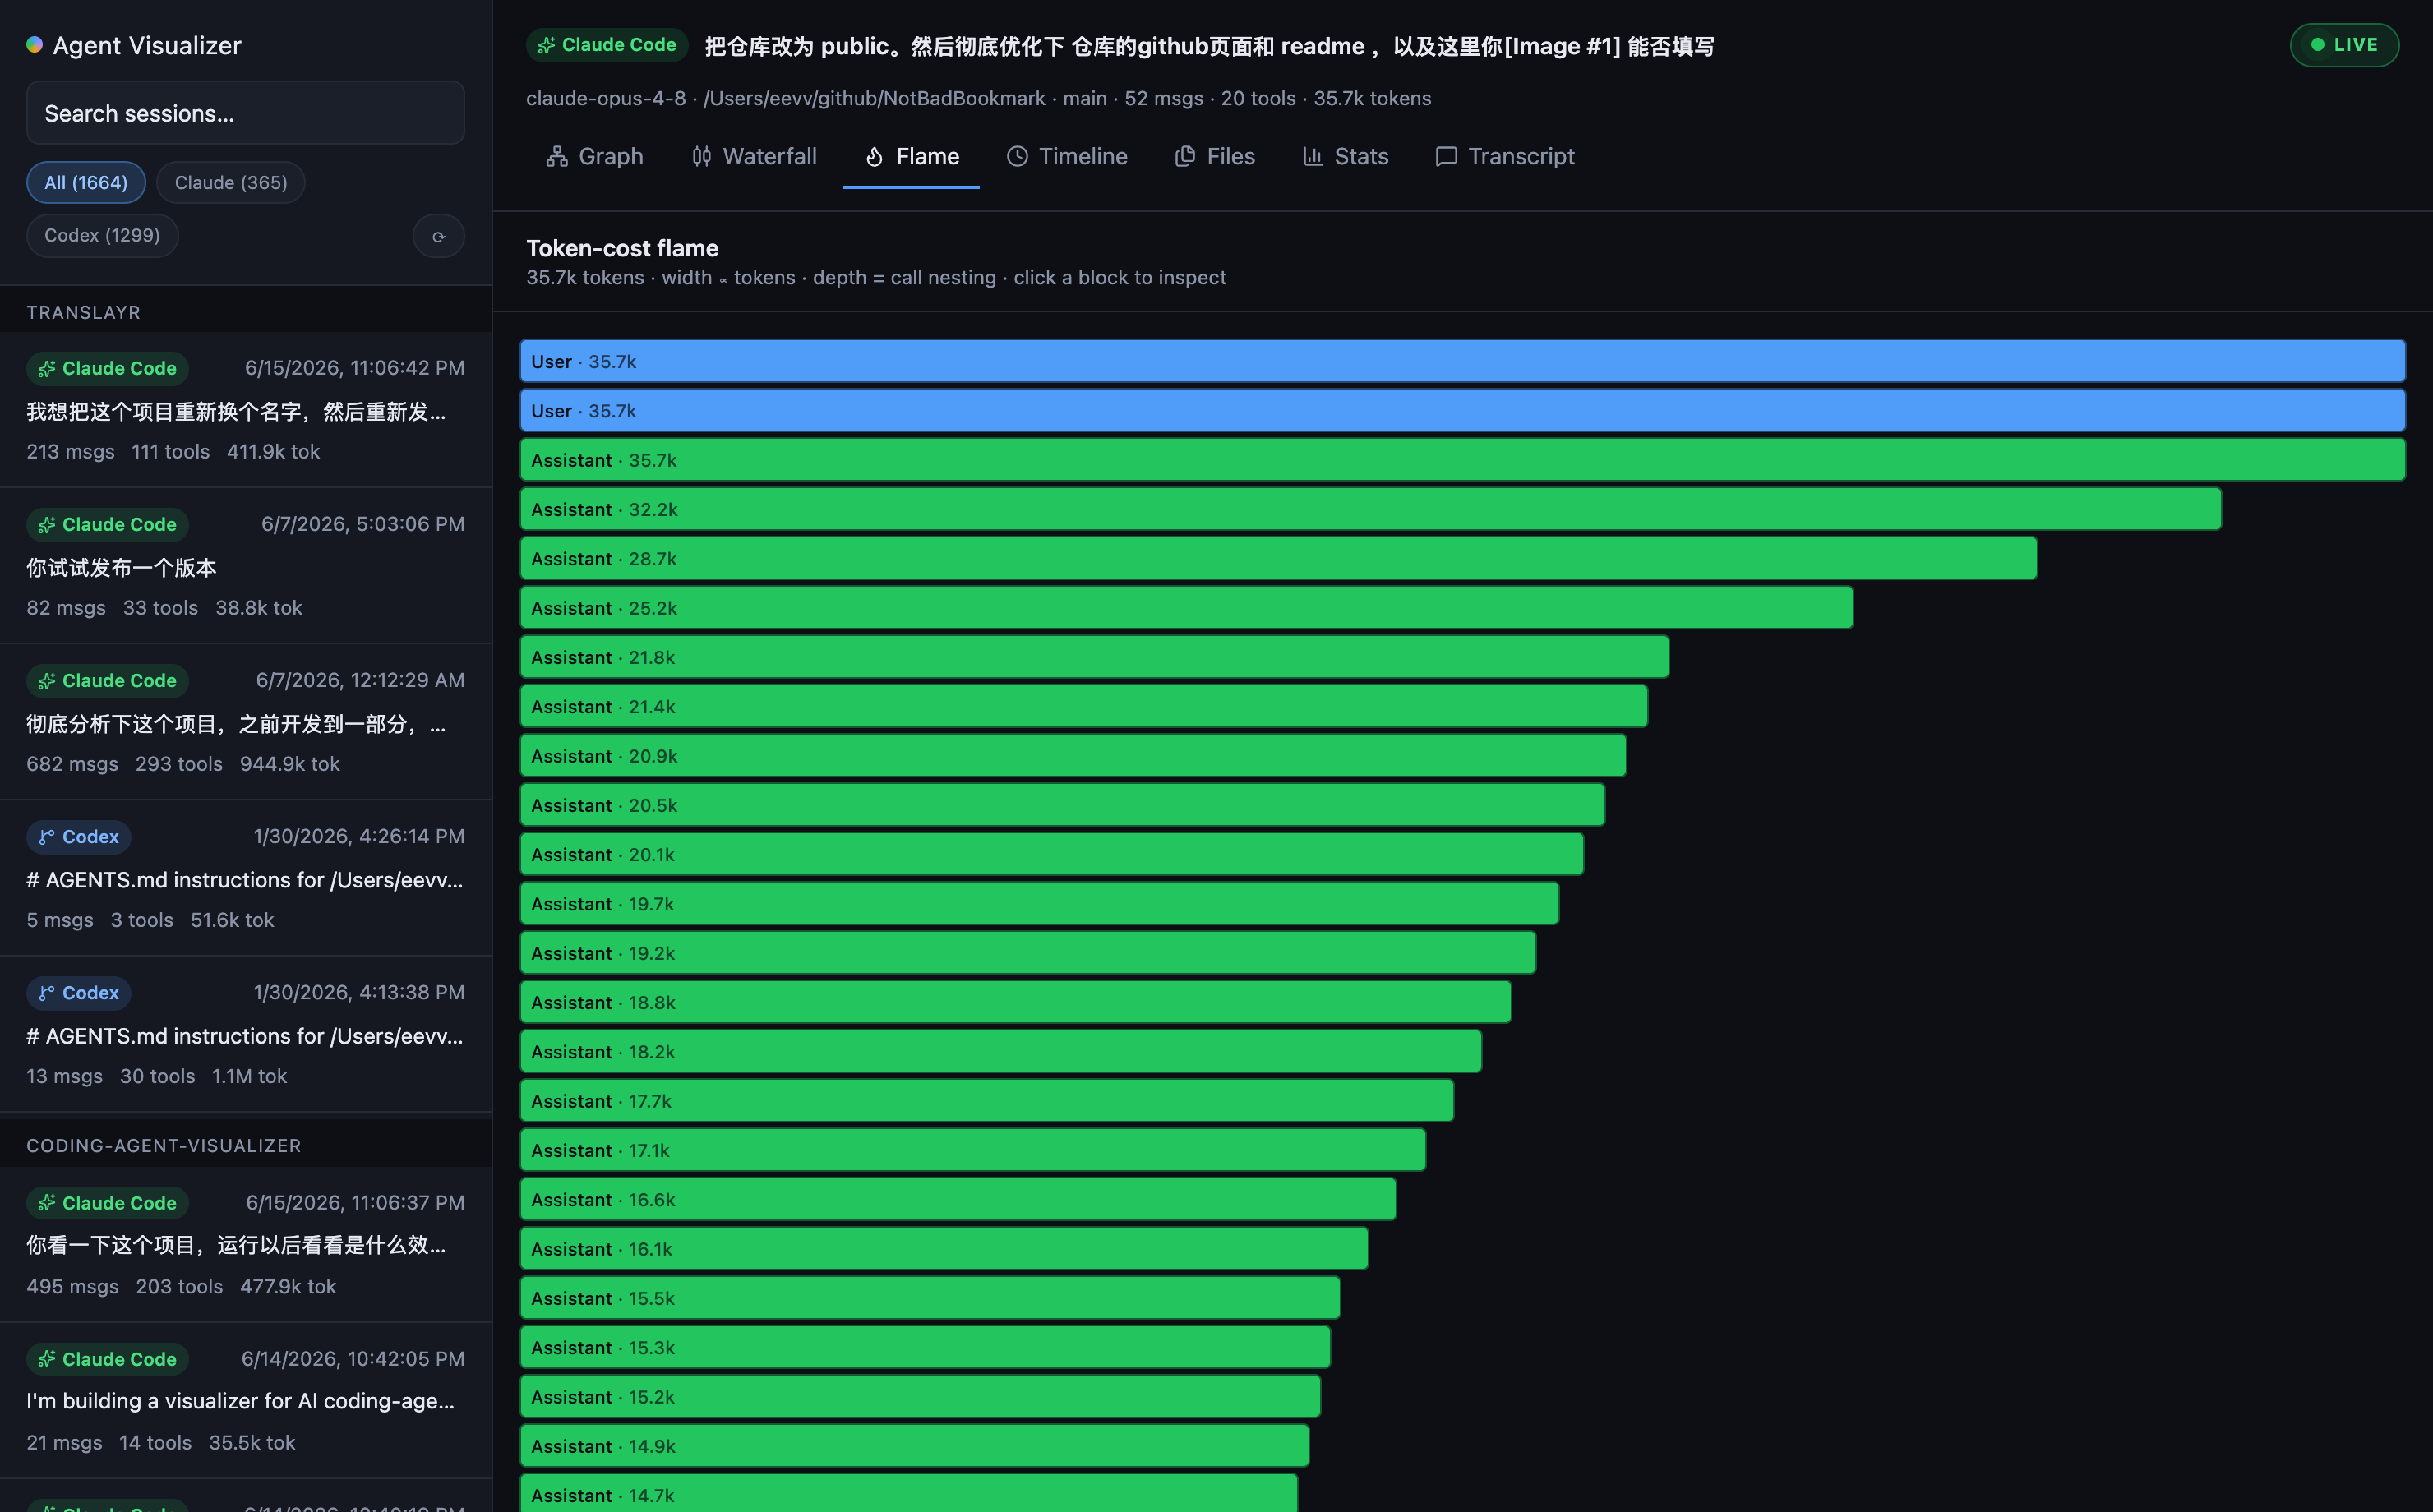
| 🔥 Token-cost flame | An icicle (top-down flame graph) where width ∝ tokens and depth = call nesting — a token-heavy turn or sub-agent jumps right out. Built on d3-hierarchy. |
| ⏱️ Timeline | Every event placed on a time track with role colors and previews — see the rhythm and gaps of a session. |
| 🗂️ File heatmap | Which files the session touched and how often, colored cool→hot by edit frequency. |
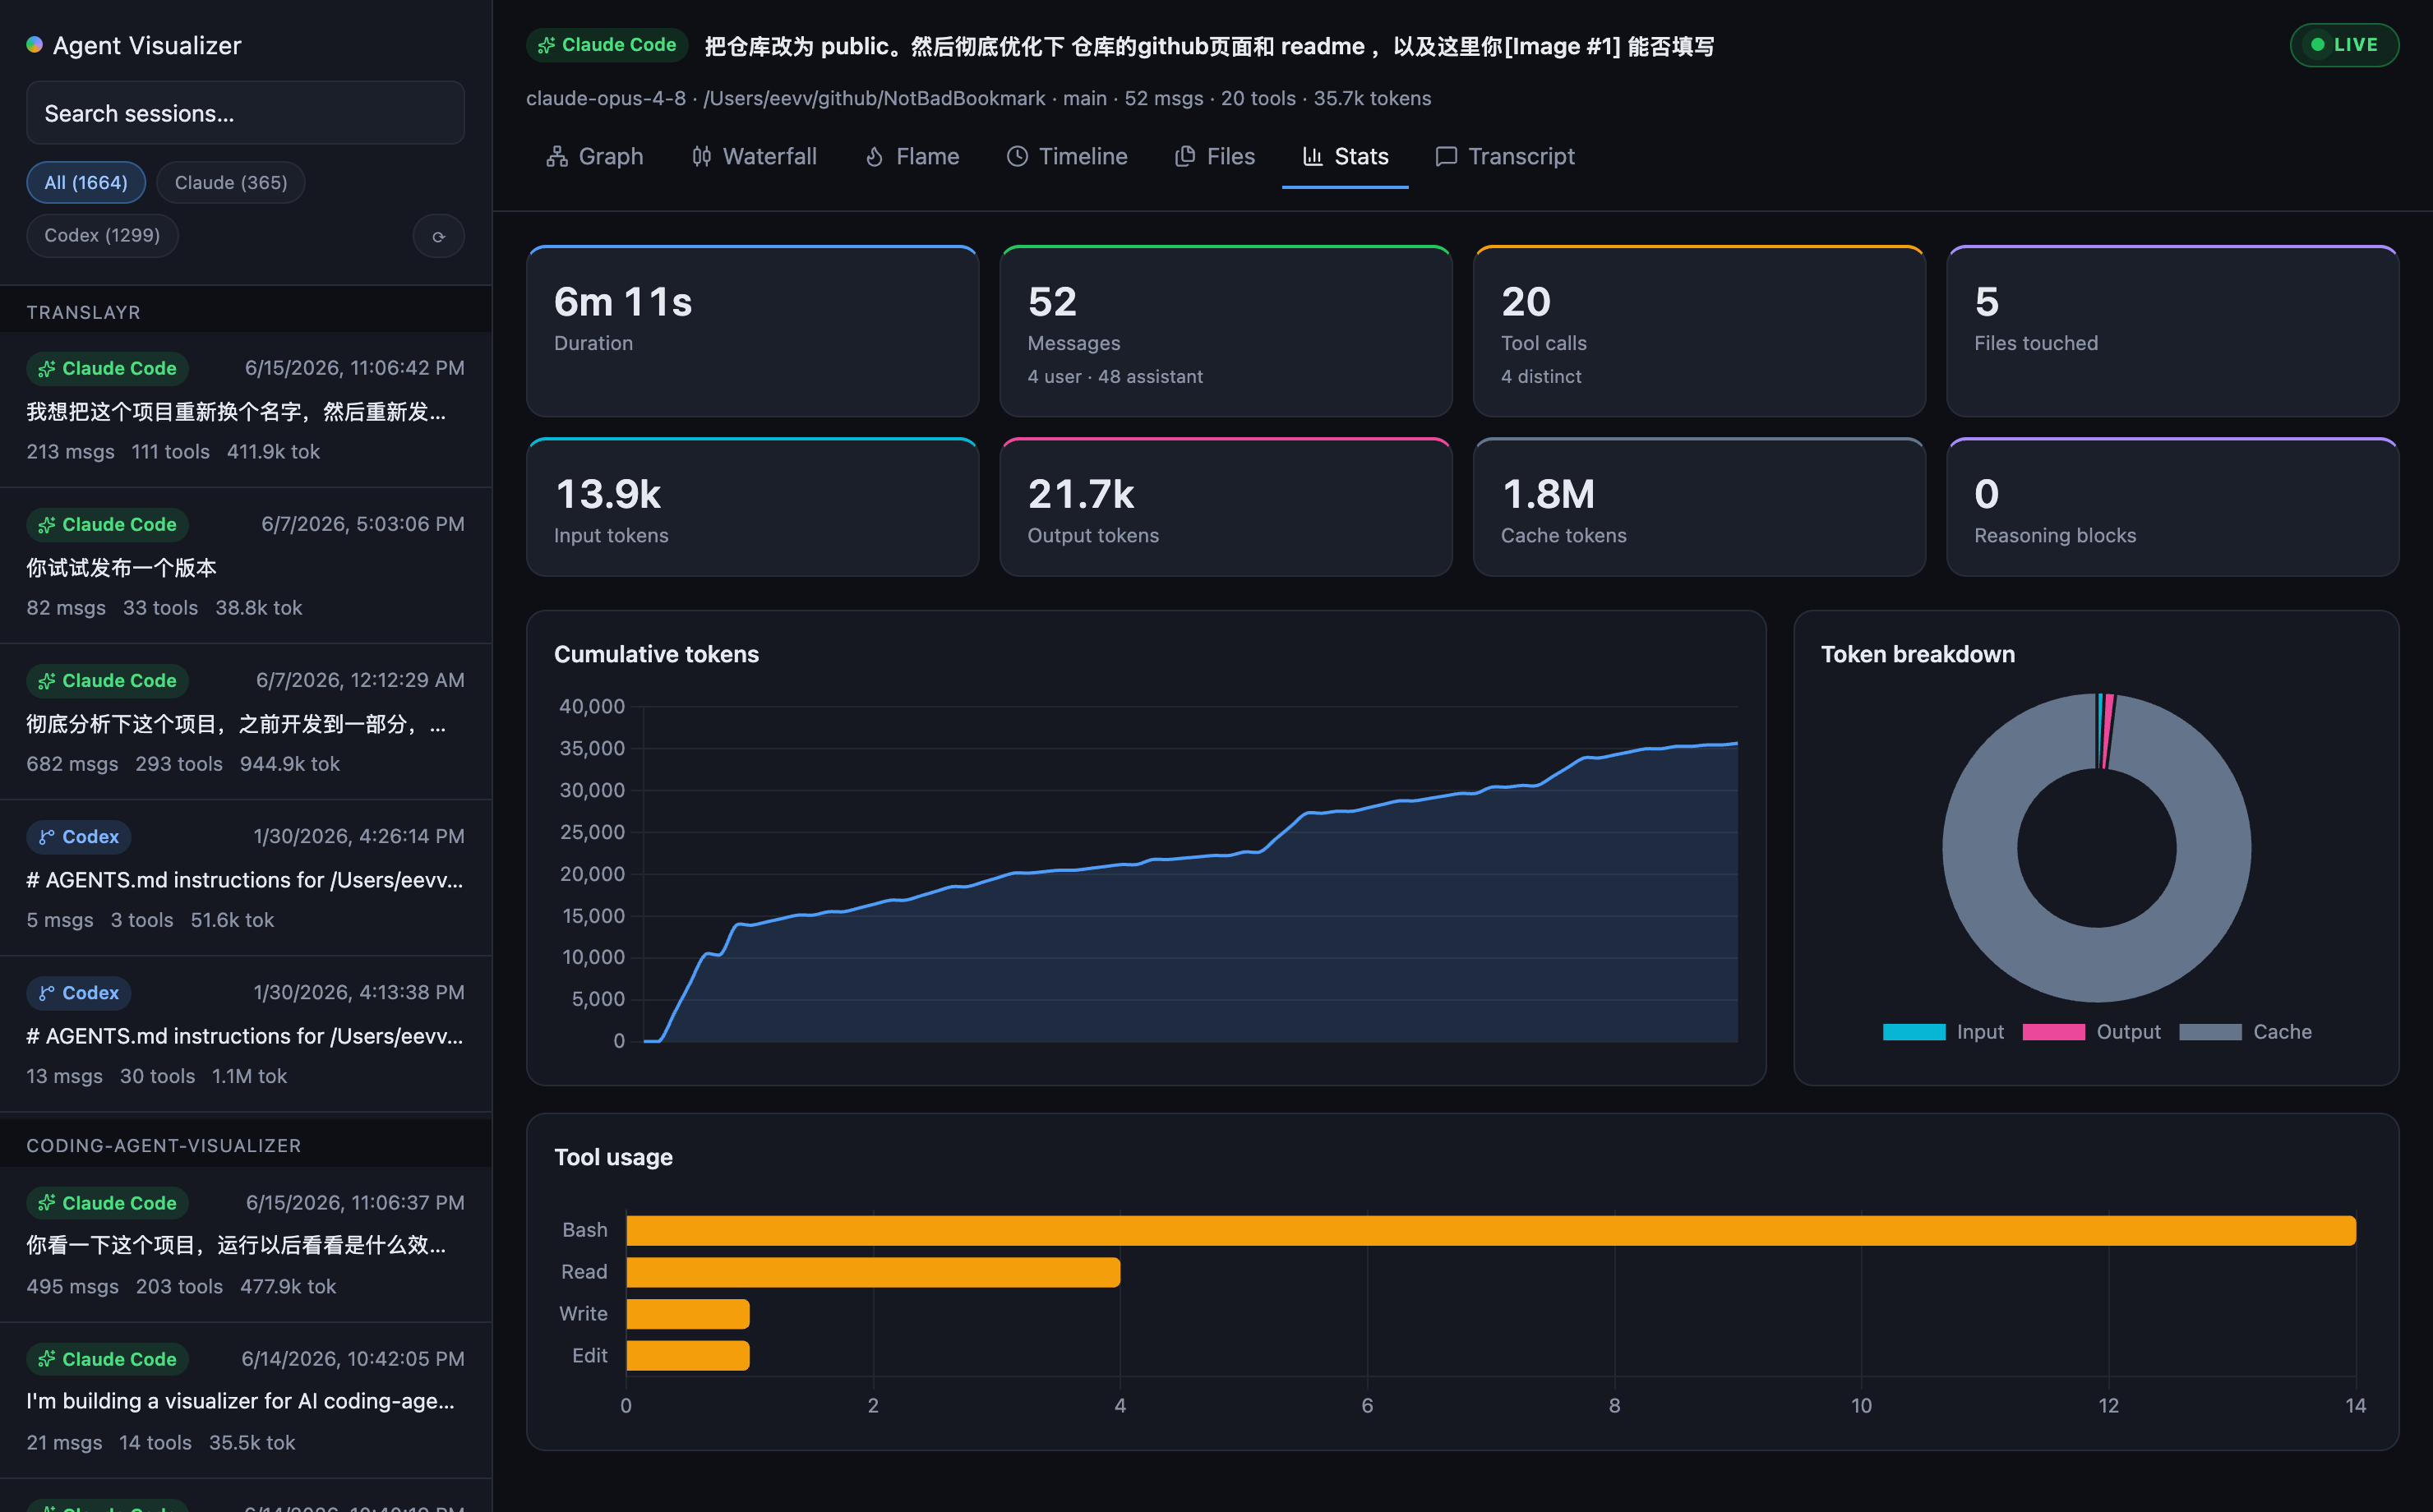
| 📊 Stats dashboard | Duration, message/tool counts, input/output/cache tokens, a cumulative-token line, a token-breakdown doughnut and per-tool bars — all rendered with Chart.js. |
| 💵 Real dollar cost | Token counts turned into USD under each model's published pricing (cache reads/writes priced separately) — per session on Stats, and aggregated total / per-model in analytics. |
| 💬 Transcript | A clean, readable conversation view with collapsible tool blocks. |
| 🔎 Full-text search | Search across every session body — messages, reasoning and tool I/O — with snippets, not just titles. |
| ⚖️ Compare sessions | Diff two runs metric-by-metric — duration, tokens, cost and tool usage with signed deltas — to see what changed when you tweaked a prompt. |
| 📂 Open any file | Drag-and-drop (or pick) a transcript from anywhere; the source is auto-detected and rendered through every view. |
| 🔍 Graph search & filters | Highlight matching nodes; toggle roles (hide reasoning/tools), flip layout horizontal/vertical. |
| 🧩 Diff & inspect | Click any node for full message / reasoning / tool I/O, with syntax-highlighted diffs for Edit/Write and one-click copy. |
| 🗂️ Multi-source | Claude Code, Codex, Gemini CLI, Qwen Code, OpenCode, Cursor and Cline today; a new agent is just one pluggable adapter away. |
| 📝 Annotations | Flag any turn and jot a private note (stored locally); export flagged turns as a Markdown review document. |
| 🌐 Online demo | A fully client-side demo — drop a transcript and explore it in the browser, nothing uploaded. |
| 🔴 Live tail | Toggle LIVE to stream a session into the graph as the agent writes to disk — watch it think in real time. |
| 📈 Cross-session analytics | Aggregate every local session: token & cost over time, tool-usage trends, and per-source / per-model / per-project breakdowns. |
| 🧬 Collapsible sub-agents | Fold a whole sub-agent (sidechain) branch into its entry node — collapse one or all at once to focus the graph. |
| 📤 Export | Save any session as Markdown or a self-contained, shareable HTML transcript — generated locally, nothing uploaded. |
🚀 Quick start
Requires Bun (≥ 1.2). Install it if you haven't:
# macOS & Linux
curl -fsSL https://bun.sh/install | bash

# Windows (PowerShell)
powershell -c "irm bun.sh/install.ps1 | iex"
Run it without cloning:
bunx coding-agent-visualizer@latest # → http://localhost:19876
Set a different port with PORT=4000 bunx coding-agent-visualizer@latest. After a
global install (bun add -g coding-agent-visualizer@latest) you can launch it with
the short cav command.
Or grab a standalone binary (no Bun needed):
Download the executable for your platform from the latest release and run it — the whole app and the Bun runtime are bundled into one file:
./coding-agent-visualizer-darwin-arm64 # → http://localhost:19876
Or clone for development:
git clone https://github.com/everettjf/coding-agent-visualizer.git
cd coding-agent-visualizer
bun install
bun dev          # → http://localhost:19876
The app auto-discovers sessions from:
- Claude Code —
~/.claude/projects/<encoded-cwd>/*.jsonl - Codex —
~/.codex/sessions/YYYY/MM/DD/rollout-*.jsonl - Gemini CLI —
~/.gemini/tmp/<project-hash>/checkpoint-*.json - Qwen Code —
~/.qwen/tmp/<project-hash>/checkpoint-*.json(Gemini-compatible fork) - OpenCode —
~/.local/share/opencode/storage/{session,message,part}/… - Cursor — the IDE's
state.vscdbSQLite (composer chats) - Cline — VS Code globalStorage
…/saoudrizwan.claude-dev/tasks/<id>/
Pick a session from the sidebar and explore — or drop any transcript file onto the window to visualize one from outside those locations. Nothing is uploaded anywhere.
🧱 Architecture
A single Bun fullstack server (Bun.serve) serves both the React UI and a
tiny local-data API — no separate backend, no database, no telemetry.
src/
├─ lib/
│  ├─ types.ts            # UnifiedSession / SessionNode — the shared model
│  ├─ stats.ts            # computeStats() + buildTrace()/buildHierarchy() derivations
│  ├─ pricing.ts          # model → published USD rates; token breakdown → cost
│  ├─ analytics.ts        # cross-session aggregation (cost/time, tool & model trends)
│  ├─ discovery.ts        # scan all sources (mtime-cached), search, upload, dispatch
│  └─ adapters/
│     ├─ claudeCode.ts    # uuid/parentUuid tree → nodes; tool calls; tokens
│     ├─ codex.ts         # rollout response_items → nodes
│     ├─ gemini.ts        # Gemini Content[] (checkpoints) → nodes; also Qwen Code (fork)
│     ├─ opencode.ts      # session/message/part JSON files → nodes
│     ├─ cursor.ts        # state.vscdb SQLite composer chats → nodes
│     └─ cline.ts         # Cline task JSON (Anthropic messages + UI events) → nodes
│  ├─ pricing.ts          # model → published USD rates; token breakdown → cost
│  ├─ search.ts           # inverted index (prefix + TF ranking) for full-text search
│  └─ parseUpload.ts      # browser-safe "detect + parse a dropped transcript"
├─ cli.ts                 # `bunx coding-agent-visualizer` launcher
├─ server/index.ts        # Bun.serve: UI + /api/sessions, /api/session, /api/analytics, /api/search, /api/parse
└─ frontend/
   ├─ App.tsx             # sidebar, search, Radix tabs, export menu, panel orchestration
   ├─ demo.tsx            # standalone client-side online demo (GitHub Pages)
   ├─ GraphView.tsx       # React Flow + dagre graph, collapsible sub-agents
   ├─ DetailPanel.tsx     # node inspector (message / reasoning / tool / diff / notes)
   ├─ ui.tsx              # role/tool/source colors + lucide icon mapping
   ├─ lib/
   │  ├─ charts.ts        # Chart.js registration + dark-theme defaults
   │  ├─ highlight.tsx    # tiny dependency-free syntax highlighter for diffs
   │  ├─ annotations.ts   # local per-node flags + notes (localStorage) + export
   │  ├─ export.ts        # session → Markdown / self-contained HTML
   │  └─ utils.ts         # cn() Tailwind class merge helper
   └─ views/              # Waterfall / Flame / Timeline / Files / Stats / Transcript / Analytics / Compare
The UI is Tailwind v4 (via bun-plugin-tailwind, wired in bunfig.toml) with
Radix primitives and lucide icons; charts are Chart.js, the graph
layout is dagre, and the flame hierarchy uses d3-hierarchy.
The unified model
Every adapter normalizes its raw format into one shape, so all views are source-agnostic and a new agent only needs a new adapter:
UnifiedSession {
  id, source, cwd, gitBranch, startedAt, endedAt,
  messageCount, toolCallCount, totalTokens, model,
  nodes: SessionNode[]          // DAG via parentId; tool calls are children
}

SessionNode {
  id, parentId, role: user | assistant | tool | reasoning | system,
  timestamp, isSidechain,       // isSidechain = Claude Code sub-agent branch
  text?, thinking?,
  tool?:   { name, input, result, isError, files[] },
  tokens?: { input, output, cacheRead, cacheCreation }
}
🔌 Adding a new source
- Create
src/lib/adapters/<name>.tsexporting a parser that returns aUnifiedSession(seeclaudeCode.tsas the reference). - Register its directory + dispatch in
src/lib/discovery.ts. - That's it — every view works automatically.
🛠️ Scripts
| Command | Description |
|---|---|
bun dev | Dev server with hot reload |
bun start | Production server |
bun run build | Bundle the frontend to dist/ (also a CI build check) |
bun run compile | Build a standalone single-file executable (no Bun needed to run) |
bun test | Adapter + library unit tests (runs against fixtures/) |
bun run typecheck | TypeScript check (tsc --noEmit) |
bun scripts/shot.ts | Headless smoke test — opens every tab, reports runtime errors |
bun scripts/capture.ts | Regenerate the README / landing-page screenshots |
All six adapters are covered by tests validated against realistic sample logs in
fixtures/: Claude Code / Codex / Gemini / Cline in adapters.test.ts, and the
non-JSONL OpenCode (fixture storage tree) and Cursor (in-memory SQLite) adapters
in extra.test.ts. Pricing/cost (pricing.test.ts), cross-session aggregation,
full-text search + upload detection (discovery.test.ts), the diff syntax
highlighter and the Markdown/HTML exporters are unit-tested too. The Claude Code
adapter is additionally verified against real local sessions (graph integrity:
single connected tree, tool results linked, files tracked).
🔒 Privacy
Everything is read from your local disk and rendered in your local browser. There is no backend service, no account, and no network egress.
📄 License
MIT © everettjf