
agent-stalker
ehartye/agent-stalker
Claude Code plugin that tracks agent team task assignment, messages, and tool use across sessions into SQLite
Instalação
npx convez-ai ehartye/agent-stalker1 comando no terminal: detecta o formato do repositório (marketplace ou plugin avulso) e instala via Claude Code. Requer Node 18+ e o Claude Code instalado.
Métricas
README
A tradução para o português deste README ainda está na fila.
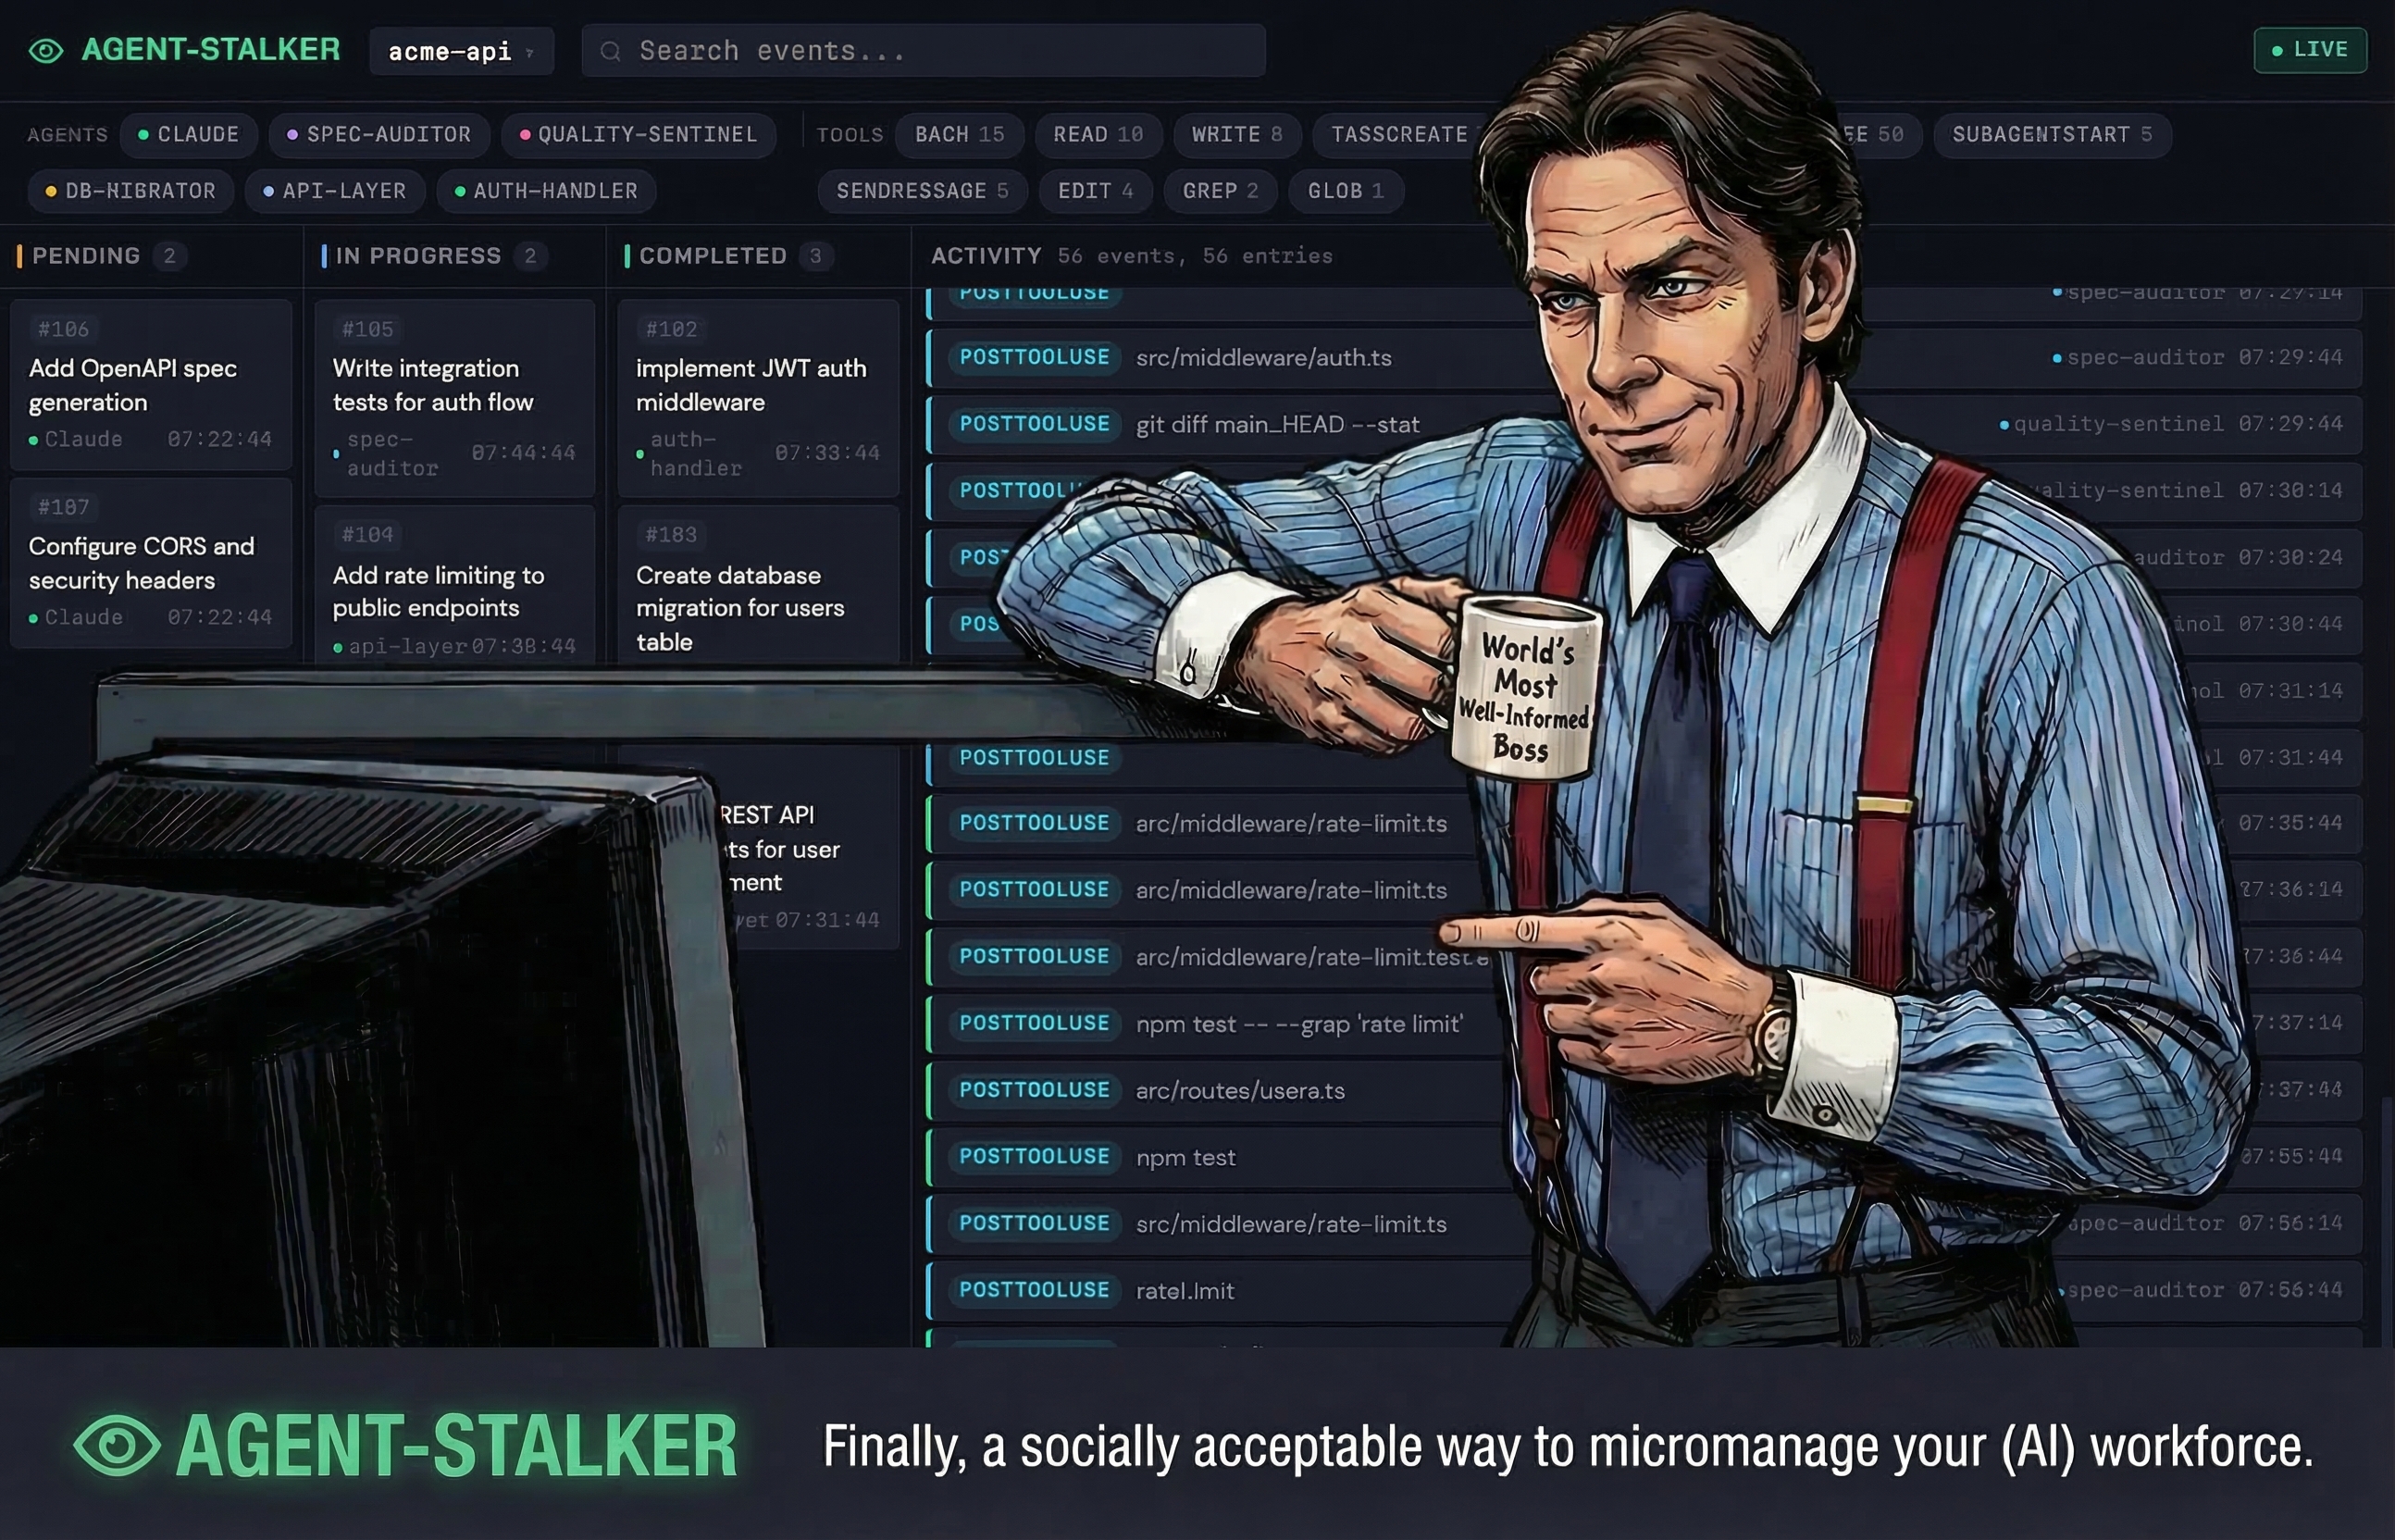
Agent Stalker
Real-time observability for Claude Code agent teams. Track sessions, tool use, task lifecycle, and inter-agent messaging through a live web dashboard and CLI query engine.
What It Does
Agent Stalker is a purely observational Claude Code plugin. It hooks into Claude's event system to record what agents do — without ever modifying or injecting into agent communication. Everything you see in the dashboard is a passive reflection of actual agent activity.
Track everything your agents do:
- Sessions — active, ended, and archived sessions with working directory context
- Tool use — every Read, Write, Bash, Edit, Grep, and custom tool call with inputs/outputs
- Agent teams — subagent spawns, stops, and per-agent activity timelines
- Task lifecycle — tasks flow through Pending → In Progress → Completed in a kanban board
- Inter-agent messaging — SendMessage calls between teammates
Screenshots
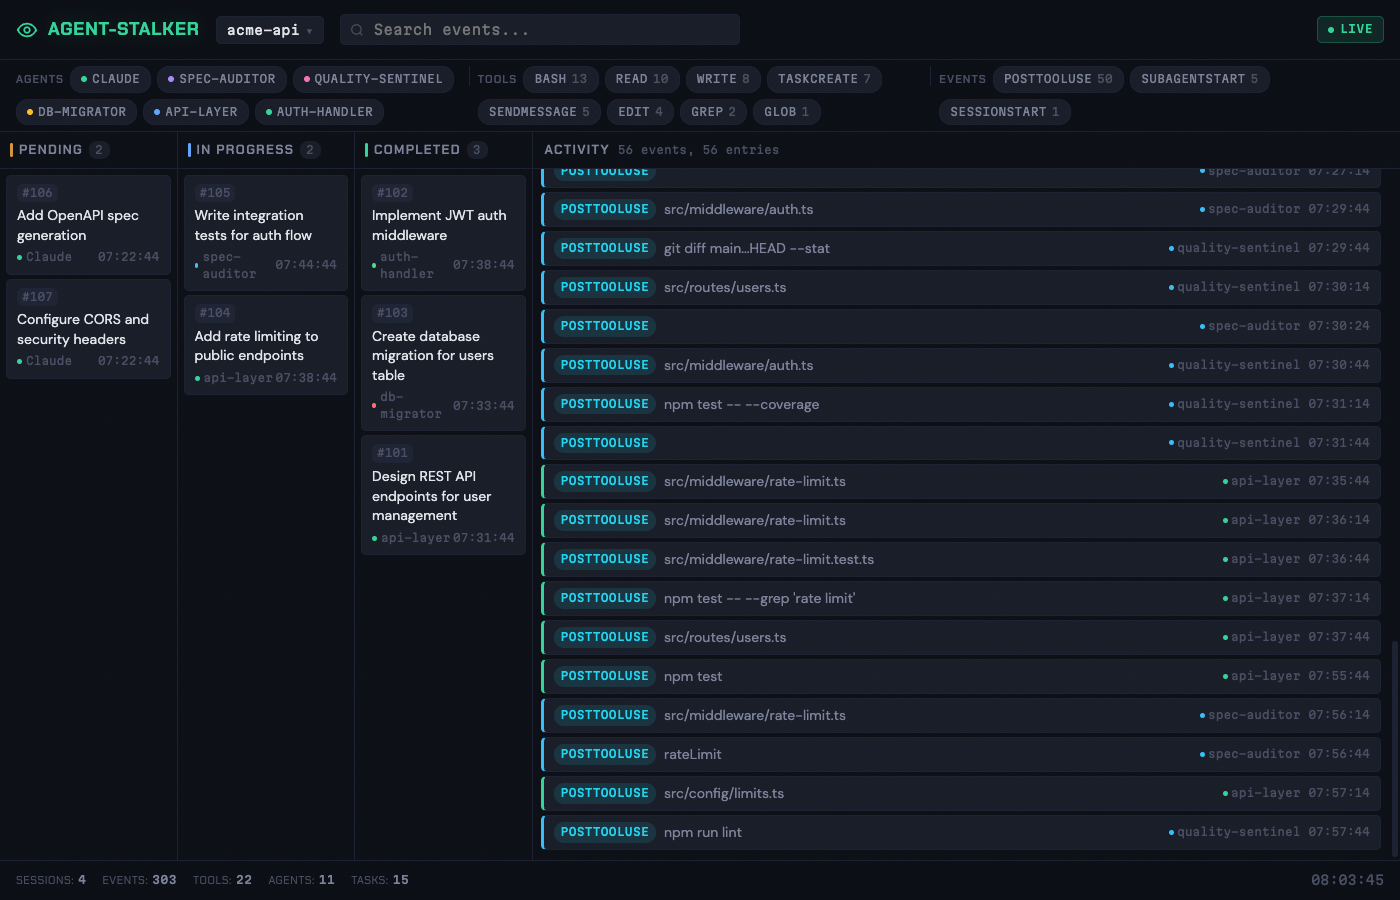
Live Dashboard
Full dashboard with kanban task board, agent/tool/event filter chips, and real-time activity feed. Each agent is color-coded for easy visual tracking.
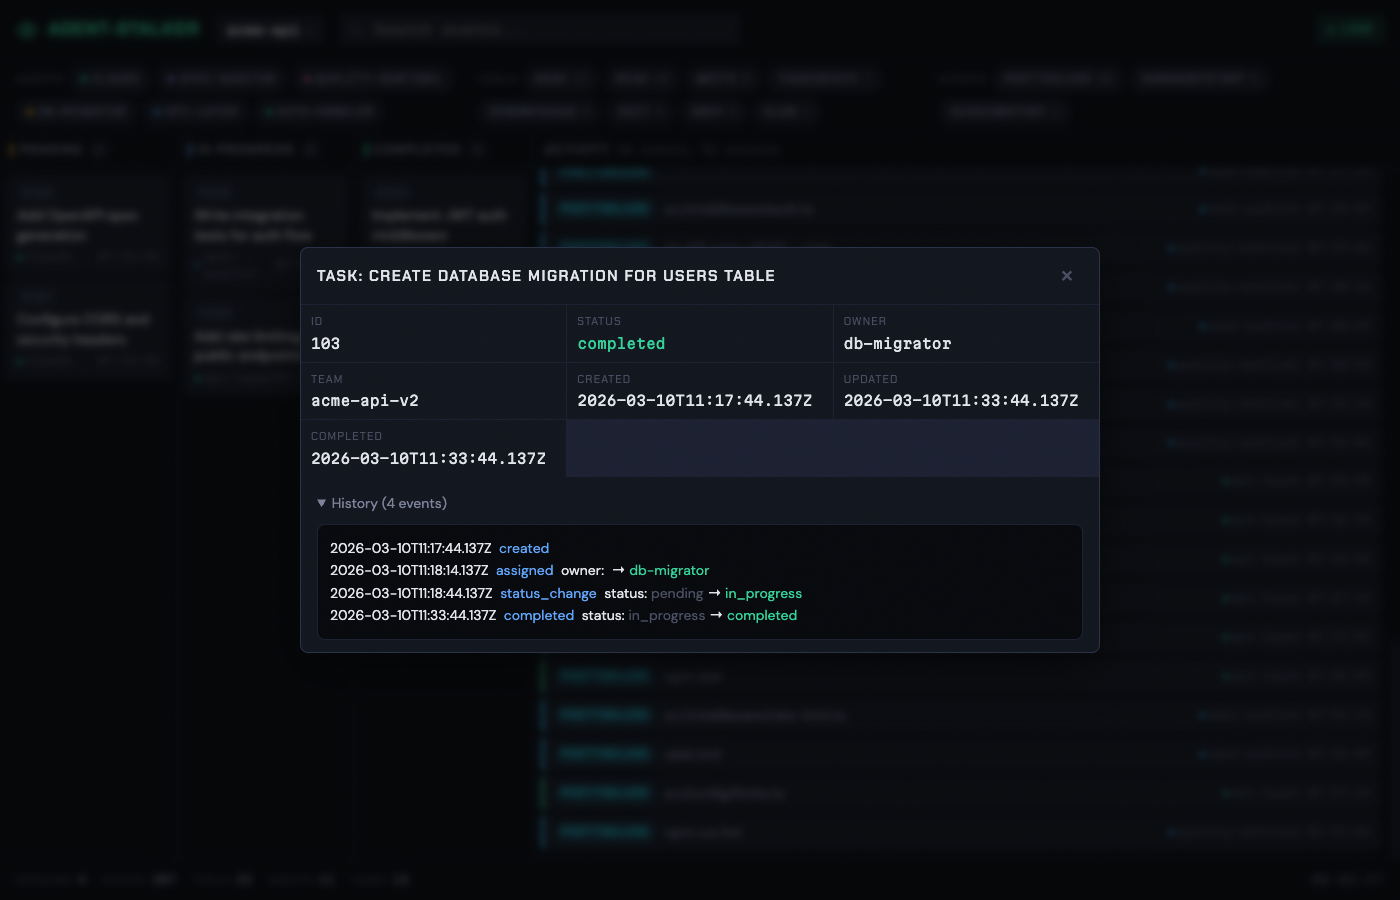
Task Detail
Click any task card to see metadata, ownership, team assignment, and full event history showing every state transition.
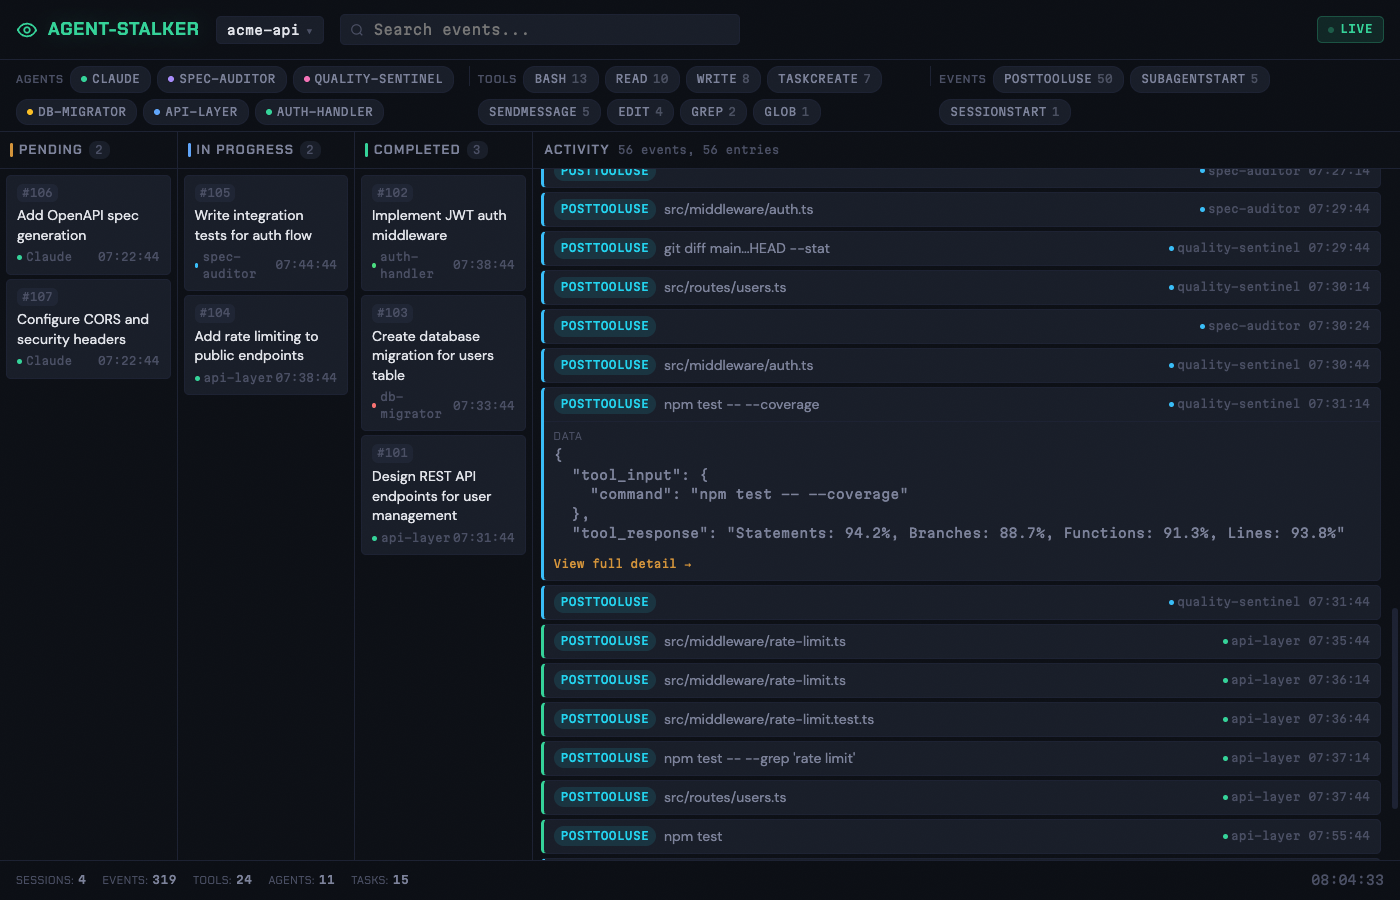
Event Detail
Expand any activity event to see the raw tool input/output JSON data with syntax highlighting.
Installation
From the Hartye Plugins Marketplace (recommended)
Add the marketplace to your Claude Code settings, then install the plugin:
# Add the marketplace (one-time setup)
claude plugins add-marketplace ehartye/hartye-claude-plugins

# Install agent-stalker
claude plugins install agent-stalker
To update to the latest version:
claude plugins update
From Source (local development)
Clone the repo and register it as a local marketplace:
git clone https://github.com/ehartye/agent-stalker.git
cd agent-stalker
bun install
Add to your Claude Code settings (~/.claude/settings.json):
{
  "extraKnownMarketplaces": [
    {
      "name": "agent-stalker-dev",
      "source": "directory",
      "path": "/path/to/agent-stalker"
    }
  ]
}
Then install:
claude plugins install agent-stalker --marketplace agent-stalker-dev
Usage
Start the Dashboard
/stalker-ui
Opens the web dashboard at http://localhost:3141. Use --port <number> to change the port.
/stalker-ui stop
Stops the running dashboard server.
Query from the CLI
/stalker sessions              # List recent sessions
/stalker tools --session <id>  # Tool use frequency
/stalker events --since 1h     # Recent events
/stalker tasks --status pending # Filter tasks by status
/stalker agents                # List all spawned agents
/stalker stats                 # Summary statistics
/stalker tokens --by model     # Captured token usage
Count Tokens
/stalker-tokens --by session   # Real captured token usage (totals + breakdown)
/stalker-tokens --since 24h    # Usage in a recent window
/stalker-tokens count <file>   # Tokenize a file (exact with ANTHROPIC_API_KEY, else an estimate)
Real counts come from the usage table (parsed from transcripts on SessionEnd). Ad-hoc tokenization of arbitrary text/files is exact when ANTHROPIC_API_KEY is set (Anthropic's free count_tokens API), otherwise a clearly-labelled local estimate.
Note: the commands above are now skills (
/stalker,/stalker-ui,/stalker-config,/stalker-tokens,/stalker-triage) — same invocation, plus contextual auto-triggering.
Configure Content Capture
/stalker-config             # Show current config
/stalker-config set Bash full       # Capture full Bash output
/stalker-config set Read metadata   # Metadata only for Read
/stalker-config reset               # Restore defaults
Default capture rules:
| Tool | Rule |
|---|---|
| Edit, Write | metadata |
| Read, Glob, Grep | metadata |
| Bash | maxLength 2000 |
| Everything else | maxLength 500 |
What is captured: events are stored in plaintext SQLite at
~/.claude/agent-stalker.db. By default file contents are not stored (metadata only); opt into full capture per-tool with/stalker-config set Edit full. The dashboard binds127.0.0.1— to view it from another machine, set"ui": { "host": "0.0.0.0" }in~/.claude/agent-stalker.config.json. If browsing by machine name rather than IP, also add the name to"allowedHosts"(e.g.["office-pc"]).
Dashboard Features
- Session selector — pick one or more sessions to view simultaneously; search by name
- Kanban board — tasks organized by status (Pending / In Progress / Completed) with owner badges
- Filter chips — filter by agent, tool name, or event type; click to toggle, counts update live
- Activity feed — chronological event stream with color-coded agent labels; click to expand JSON detail
- Task modals — click any task card for full metadata and event history
- Live mode — auto-polls for new events; handles browser tab throttling with visibility-change detection
- Search — filter events by text across tool names, file paths, and commands
- Stats footer — session count, total events, unique tools, agents, and tasks at a glance
Insights / meta-analysis
The Insights view (toggle in the dashboard header, next to Activity) surfaces pockets of high thrash, churn, error, and token usage across your agentic workflows. It has two layers.
Every Insights table is sortable (click a column header) and every row drills in — sessions open in the Activity view, single prompts/tasks open a detail modal, and aggregate rows (a file, tool, error cluster, topic, or retry chain) open a list of their underlying events.
Structured metrics (always on)
Computed directly from the captured events — no extra setup, no external services:
- Pain leaderboard — a per-session composite score combining error rate, file churn, thrash, and effort, each normalized and weighted; every row shows an explainable breakdown so you can see why a session scored high.
- Token usage — real input/output/cache token totals per session (populated by the usage ingest; see below).
- File churn — files edited most often, with edit counts, the sessions touching them, and the median gap between edits.
- Errors — error counts by tool and by session (with error rate).
- Thrash / pivot-loops — error→retry chains on the same tool+target, and task status "bounces" (re-entering a status the task was already in).
Token usage capture: real token counts come from the Claude Code transcript
JSONL files, parsed into a usage table. This runs automatically on SessionEnd,
or on demand:
bun run ingest-usage
Until a session's transcript has been ingested, the effort signal falls back to a byte-based proxy.
Semantic sidecar (opt-in)
An optional Python layer adds NLP-based insight: frustration/sentiment, topic
modeling, error clustering, and semantic pivot detection. It is opt-in and runs
as a separate batch process that reads the same SQLite database and writes
semantic_* tables; the dashboard hides these panels until they contain data.
(Session triage is not part of this sidecar — it needs no API key and runs in
Claude Code; see below.)
To enable it, install the Python dependencies once:
pip install -r analysis/requirements.txt
Then click Enable semantic features in the Insights view (or run
python -m agent_stalker_analysis run from analysis/). After it completes,
refresh to see the Topics, Error clusters, Frustration, and
Agent pivots panels populate.
Session triage (no API key): each pain-leaderboard row has a Flag for triage
button. Clicking it marks the session in the database; then run the packaged
/stalker-triage skill in Claude Code, which reads the flagged sessions, scores
each one's workflow pain, and writes a summary + root cause back so the dashboard's
Triage panel shows them. No Anthropic API key and no token cost — the analysis runs
in the Claude Code session you're already using.
See analysis/README.md for the full sidecar install/run guide,
the SQLite contract, and environment variables.
Architecture
hooks/tracker.ts          # Hook entrypoint — receives events via stdin
lib/ingest.ts             # Parses hook payloads, writes to SQLite
lib/db.ts                 # Database schema + migrations (v1-v7)
lib/query.ts              # CLI query engine
lib/config.ts             # Content capture configuration
lib/truncate.ts           # Content truncation per capture rules
lib/resolve-team.ts       # Team/agent resolution logic
ui/server.ts              # Bun HTTP server — REST API + static files
ui/app.js                 # Single-file dashboard UI (vanilla JS)
ui/index.html             # Dashboard HTML shell
ui/style.css              # Dark theme styles
commands/                 # Slash command definitions
.claude-plugin/plugin.json # Plugin manifest
hooks/hooks.json          # Hook event registrations
All hooks run asynchronously via bun and write to a shared SQLite database at ~/.claude/agent-stalker.db (WAL mode for concurrent access). The web UI reads from the same database via a lightweight REST API.
Tracked Hook Events
| Event | What's Captured |
|---|---|
SessionStart / SessionEnd | Session lifecycle, CWD, model, permissions |
PreToolUse / PostToolUse | Tool name, inputs, outputs (per capture rules) |
SubagentStart / SubagentStop | Agent spawn/stop with type and transcript path |
TaskCompleted | Task completion with subject and owner |
TeammateIdle | Idle agent detection |
UserPromptSubmit | User prompt submissions |
Stop | Session stop events |
Requirements
- Bun runtime (used by hooks and the dashboard server)
- Claude Code with plugin support
License
MIT