
paper-figures
DRZ-hang/paper-figures
A Claude skill that turns a research paper's raw data into publication-ready statistical figures and academic three-line tables via reproducible Python — with journal presets, automatic chart selection, image self-check, and a bilingual (中文/English) Word report.
Instalação
npx convez-ai DRZ-hang/paper-figures1 comando no terminal: detecta o formato do repositório (marketplace ou plugin avulso) e instala via Claude Code. Requer Node 18+ e o Claude Code instalado.
Métricas
README
A tradução para o português deste README ainda está na fila.
English · 中文
📊 paper-figures
Turn your paper's raw data into publication-ready figures & tables — with one AI skill.





paper-figures is an Agent Skill — portable across Claude Code, OpenAI Codex, and other skill-capable agents — that takes a manuscript and its raw data and produces the figures and tables a journal will accept. Every result comes from genuine statistical computation on your own data, and each chart is chosen to fit what the paper sets out to argue. Figures are drawn by plotting code (matplotlib, seaborn, and friends), so the whole pipeline is free of any generative image model and stays well clear of the AI image-generation line — every pixel traces back to a number in your dataset. The skill reads the paper, finds where visuals are needed, picks the right statistics and chart for the data, applies the target journal's formatting, renders, checks its own output by looking at the rendered image, exports numbered assets, and hands you a Word report — in English, Chinese, or bilingual — with every caption, annotation, and in-text citation location.
✨ Highlights
- 🛡️ Real computation, not generated images — figures come from statistical analysis and plotting code run on your raw data. The pipeline uses no generative image model, so results are traceable, reproducible, and stay clear of the AI image-generation line.
- 🔬 Data-first & honest — every figure reveals what is already true in your data. Axes keep a faithful baseline, sample sizes and error definitions are stated, and p-values are computed from the data.
- 📈 The right chart, chosen for you — a built-in decision guide maps your data's shape + your claim to the correct chart and statistical test.
- 🎓 Journal-ready formatting — configurable presets (Nature / Science / Cell / IEEE / Elsevier / PLOS + a generic default): column widths, fonts, dpi, colorblind-safe palettes.
- 🧬 Vector output with editable text — figures export as true vector PDF (and SVG/EPS), with fonts embedded so every label stays selectable and editable for a typesetter; a high-dpi raster (PNG/TIFF) ships alongside for quick preview.
- 📐 Academic three-line tables (三线表) in Word, the standard format reviewers expect.
- 🌏 Output language is your choice — English-only, Chinese-only, or bilingual captions & reports.
- 🧰 Full plotting stack — matplotlib · seaborn · plotnine · plotly, plus lifelines & scikit-learn for survival/ML.
- ♻️ 100% reproducible — fixed seeds, saved scripts, recorded versions.
🖼 See it in action
Two complete, end-to-end runs on real, openly-licensed published papers live in
examples/ — raw data in, the figures and a Word report below out. Every image here
was produced by the skill from the cited paper's own data.
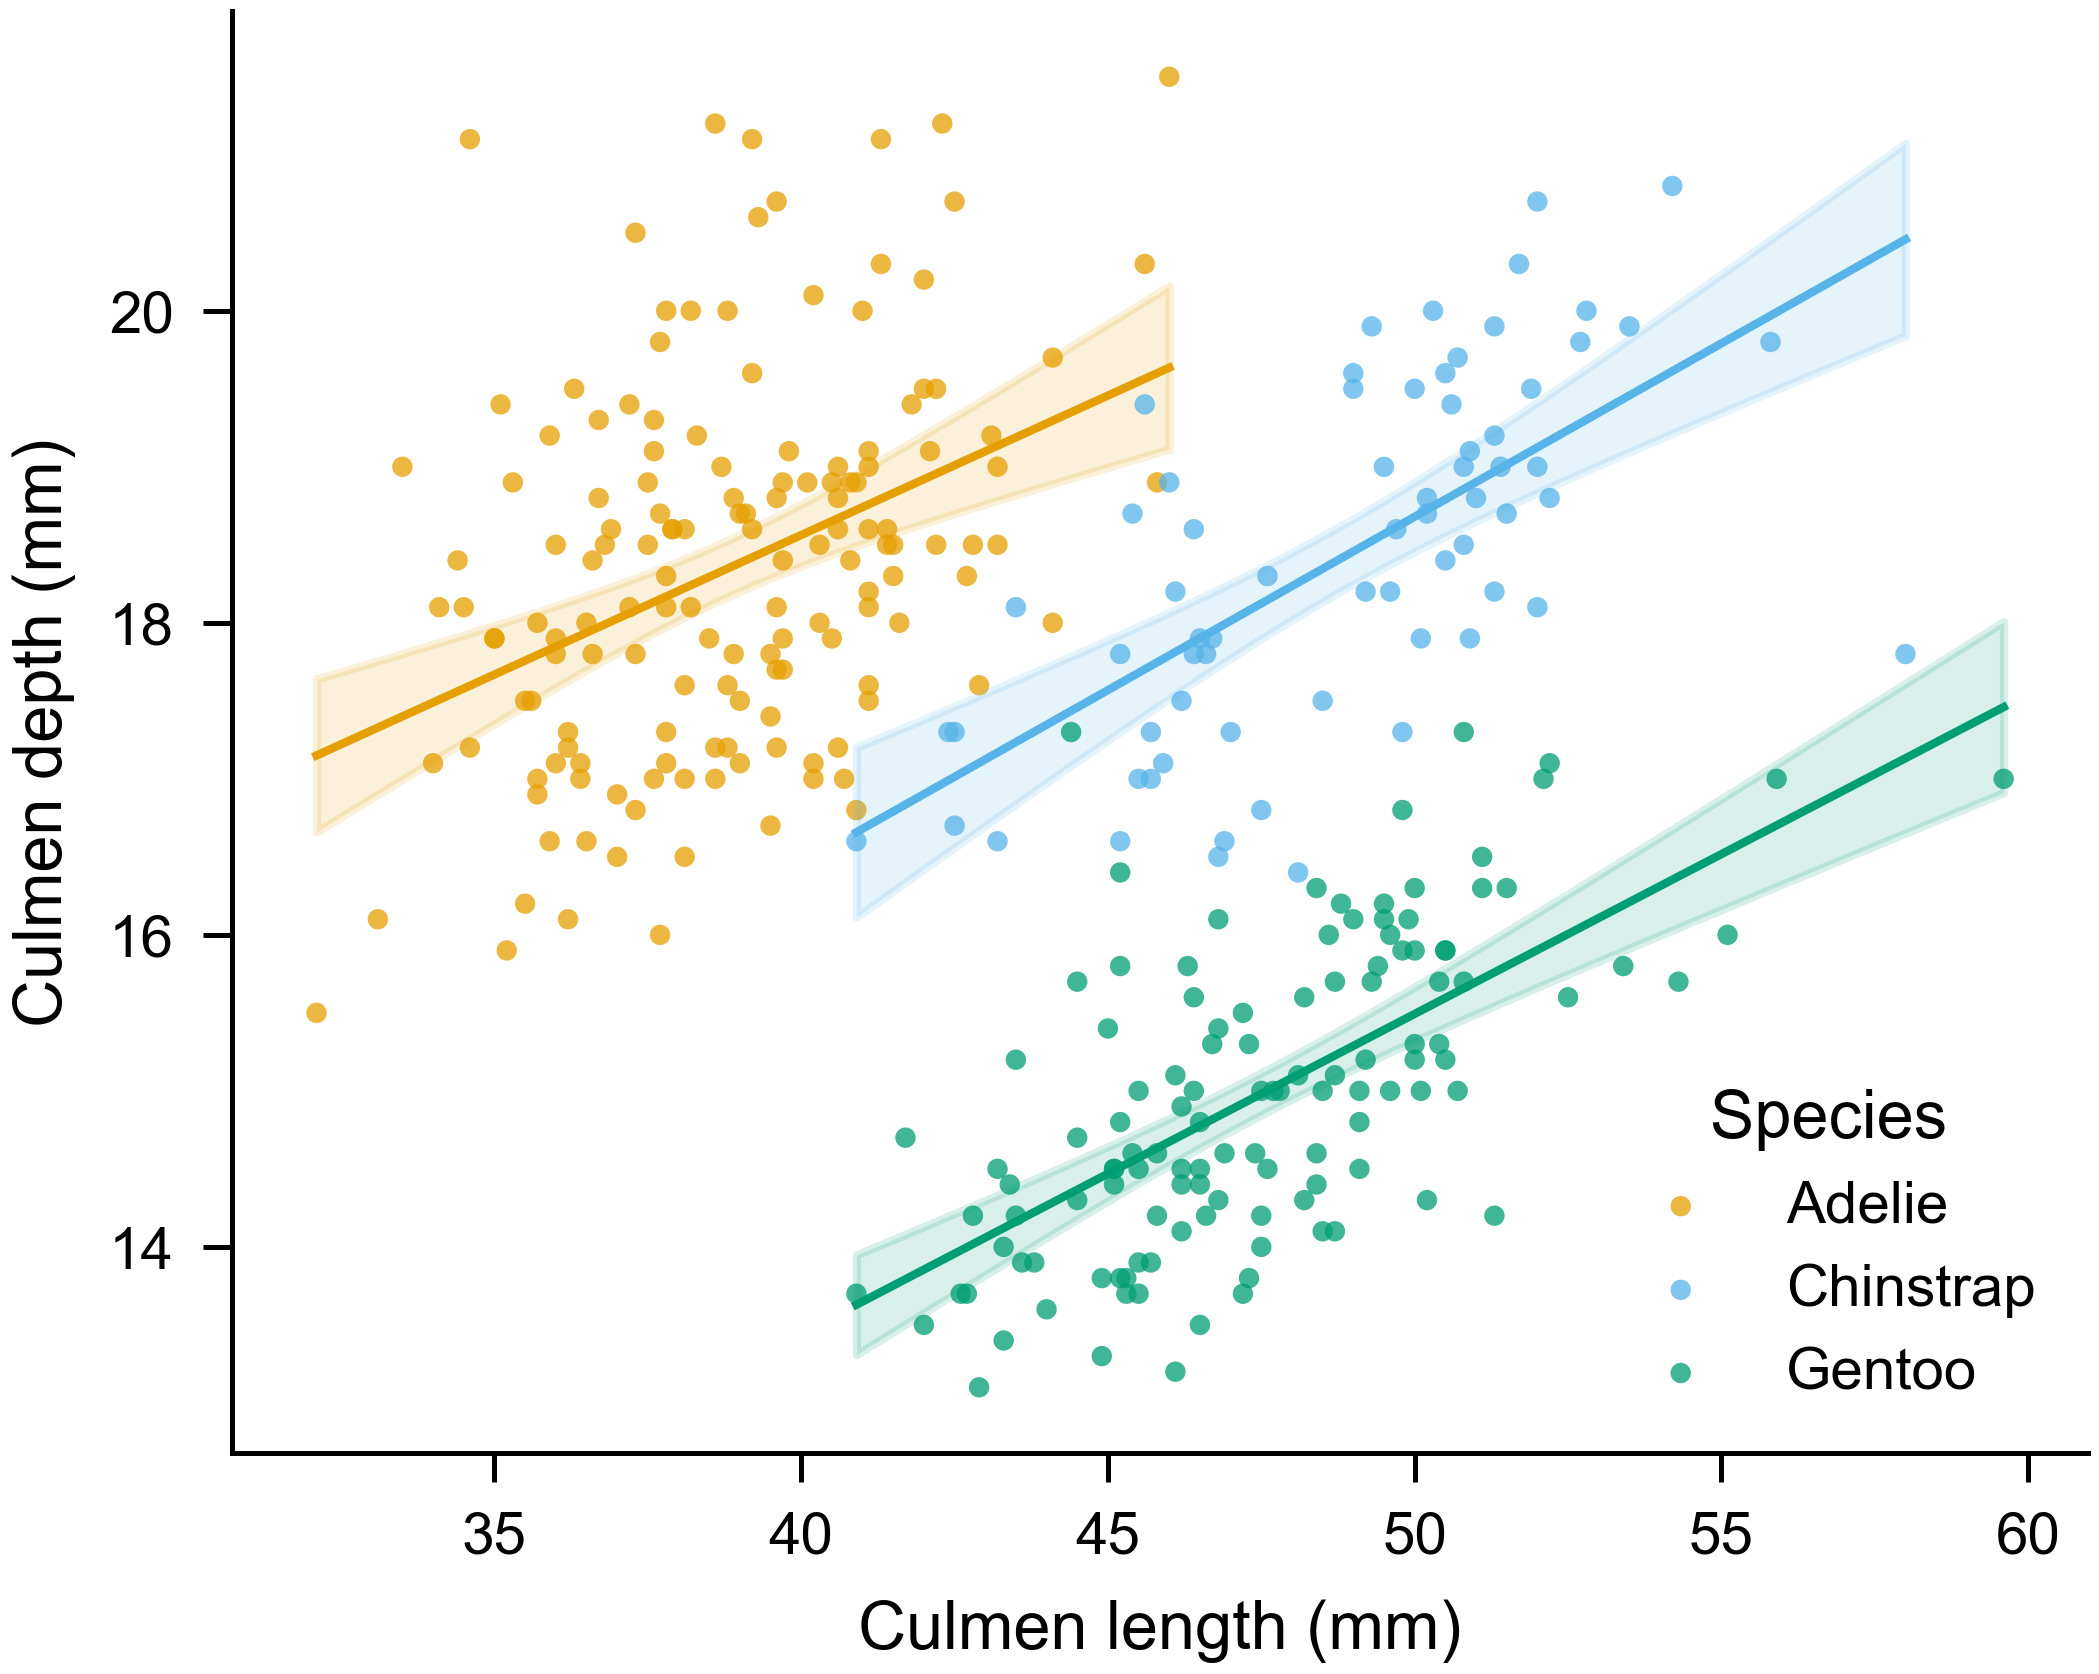
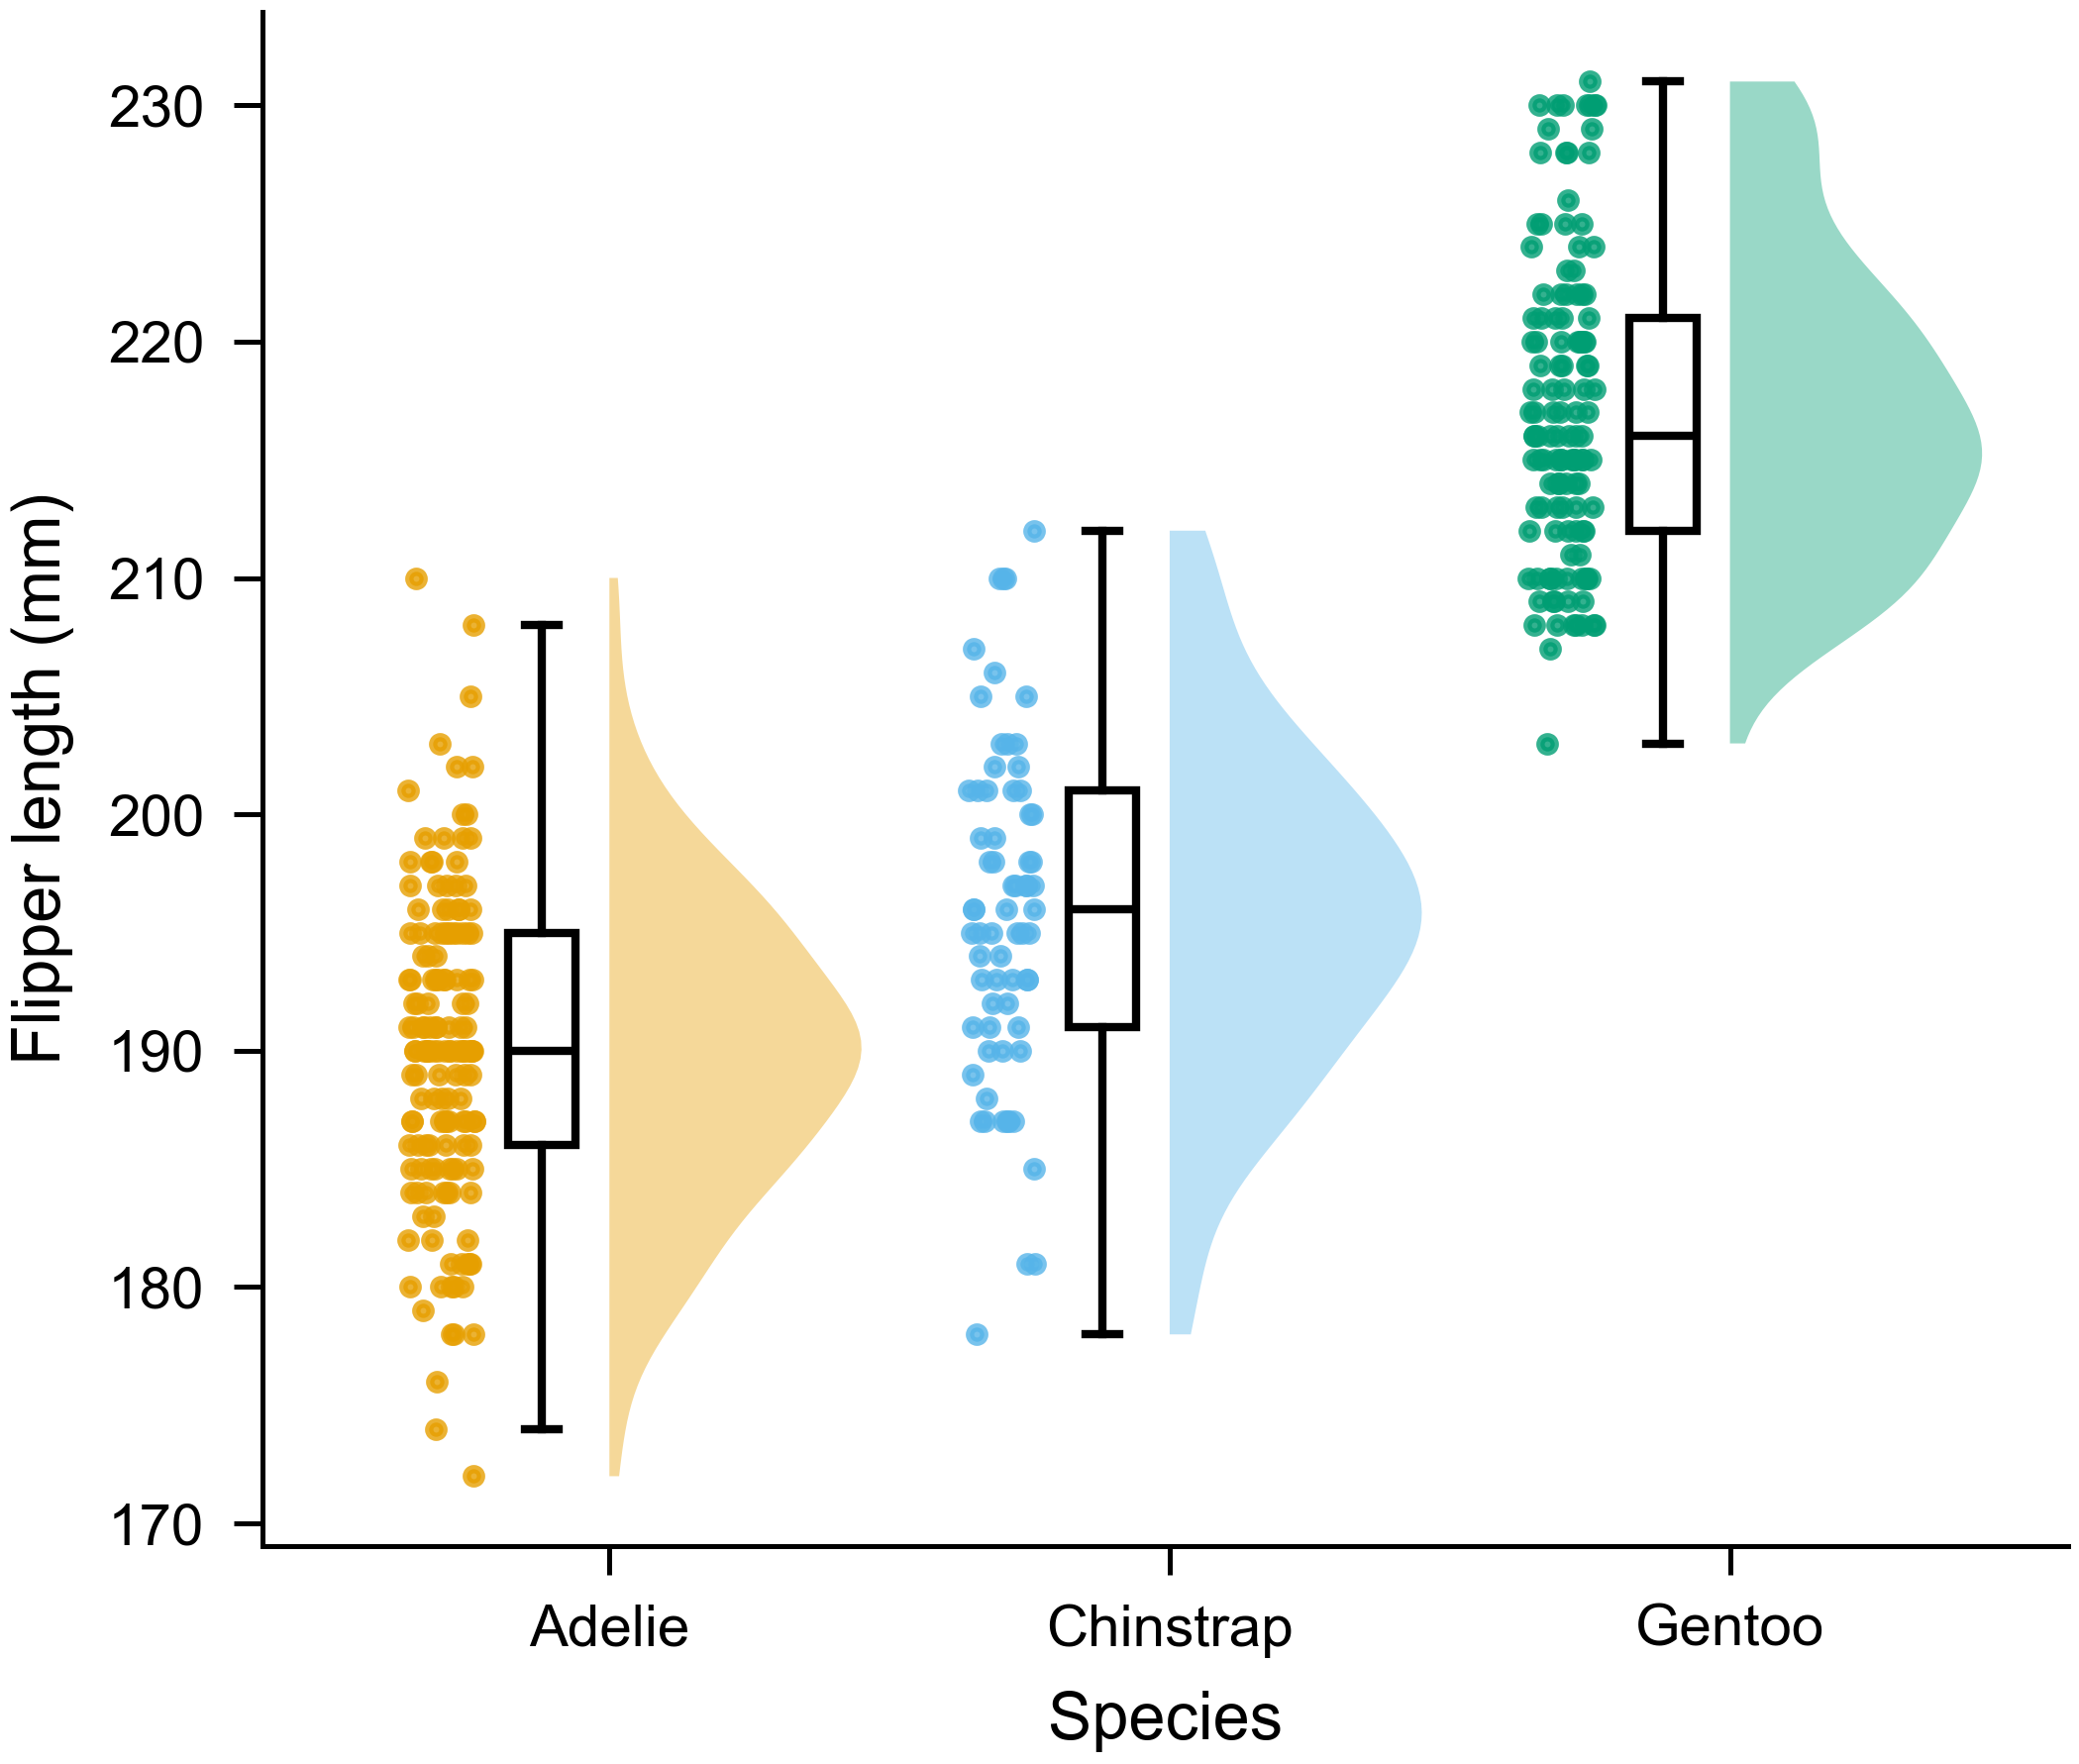
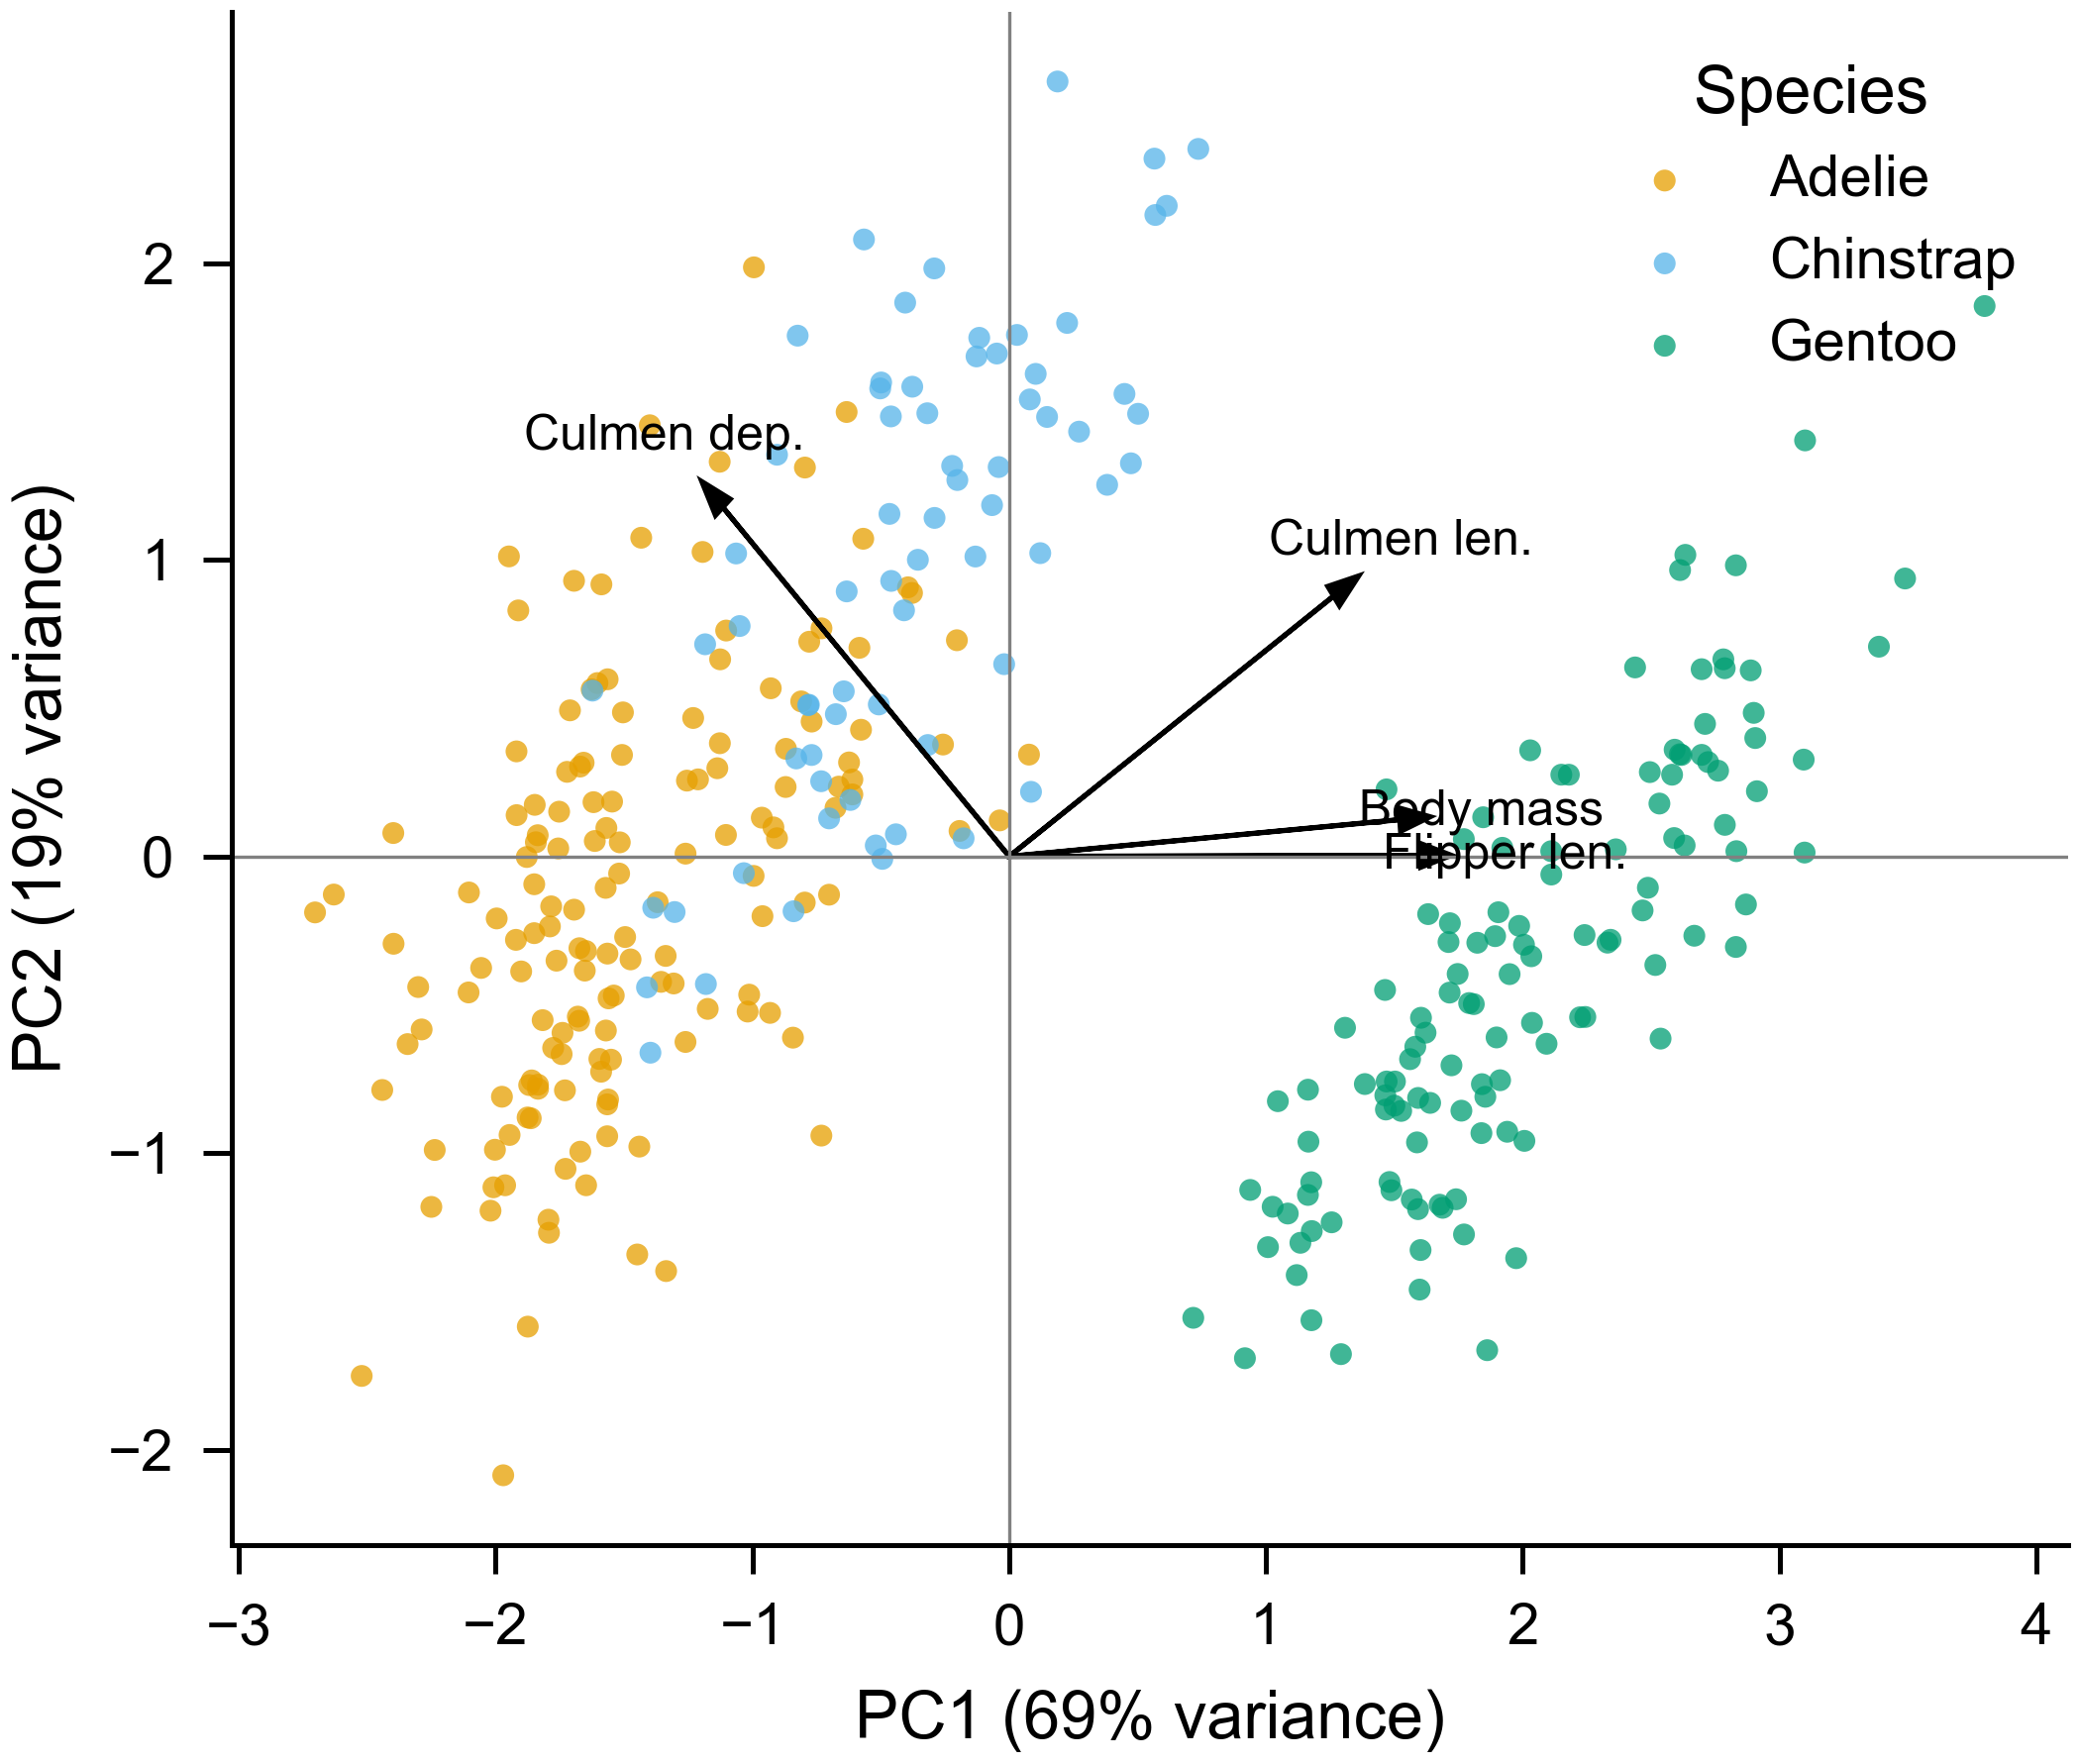
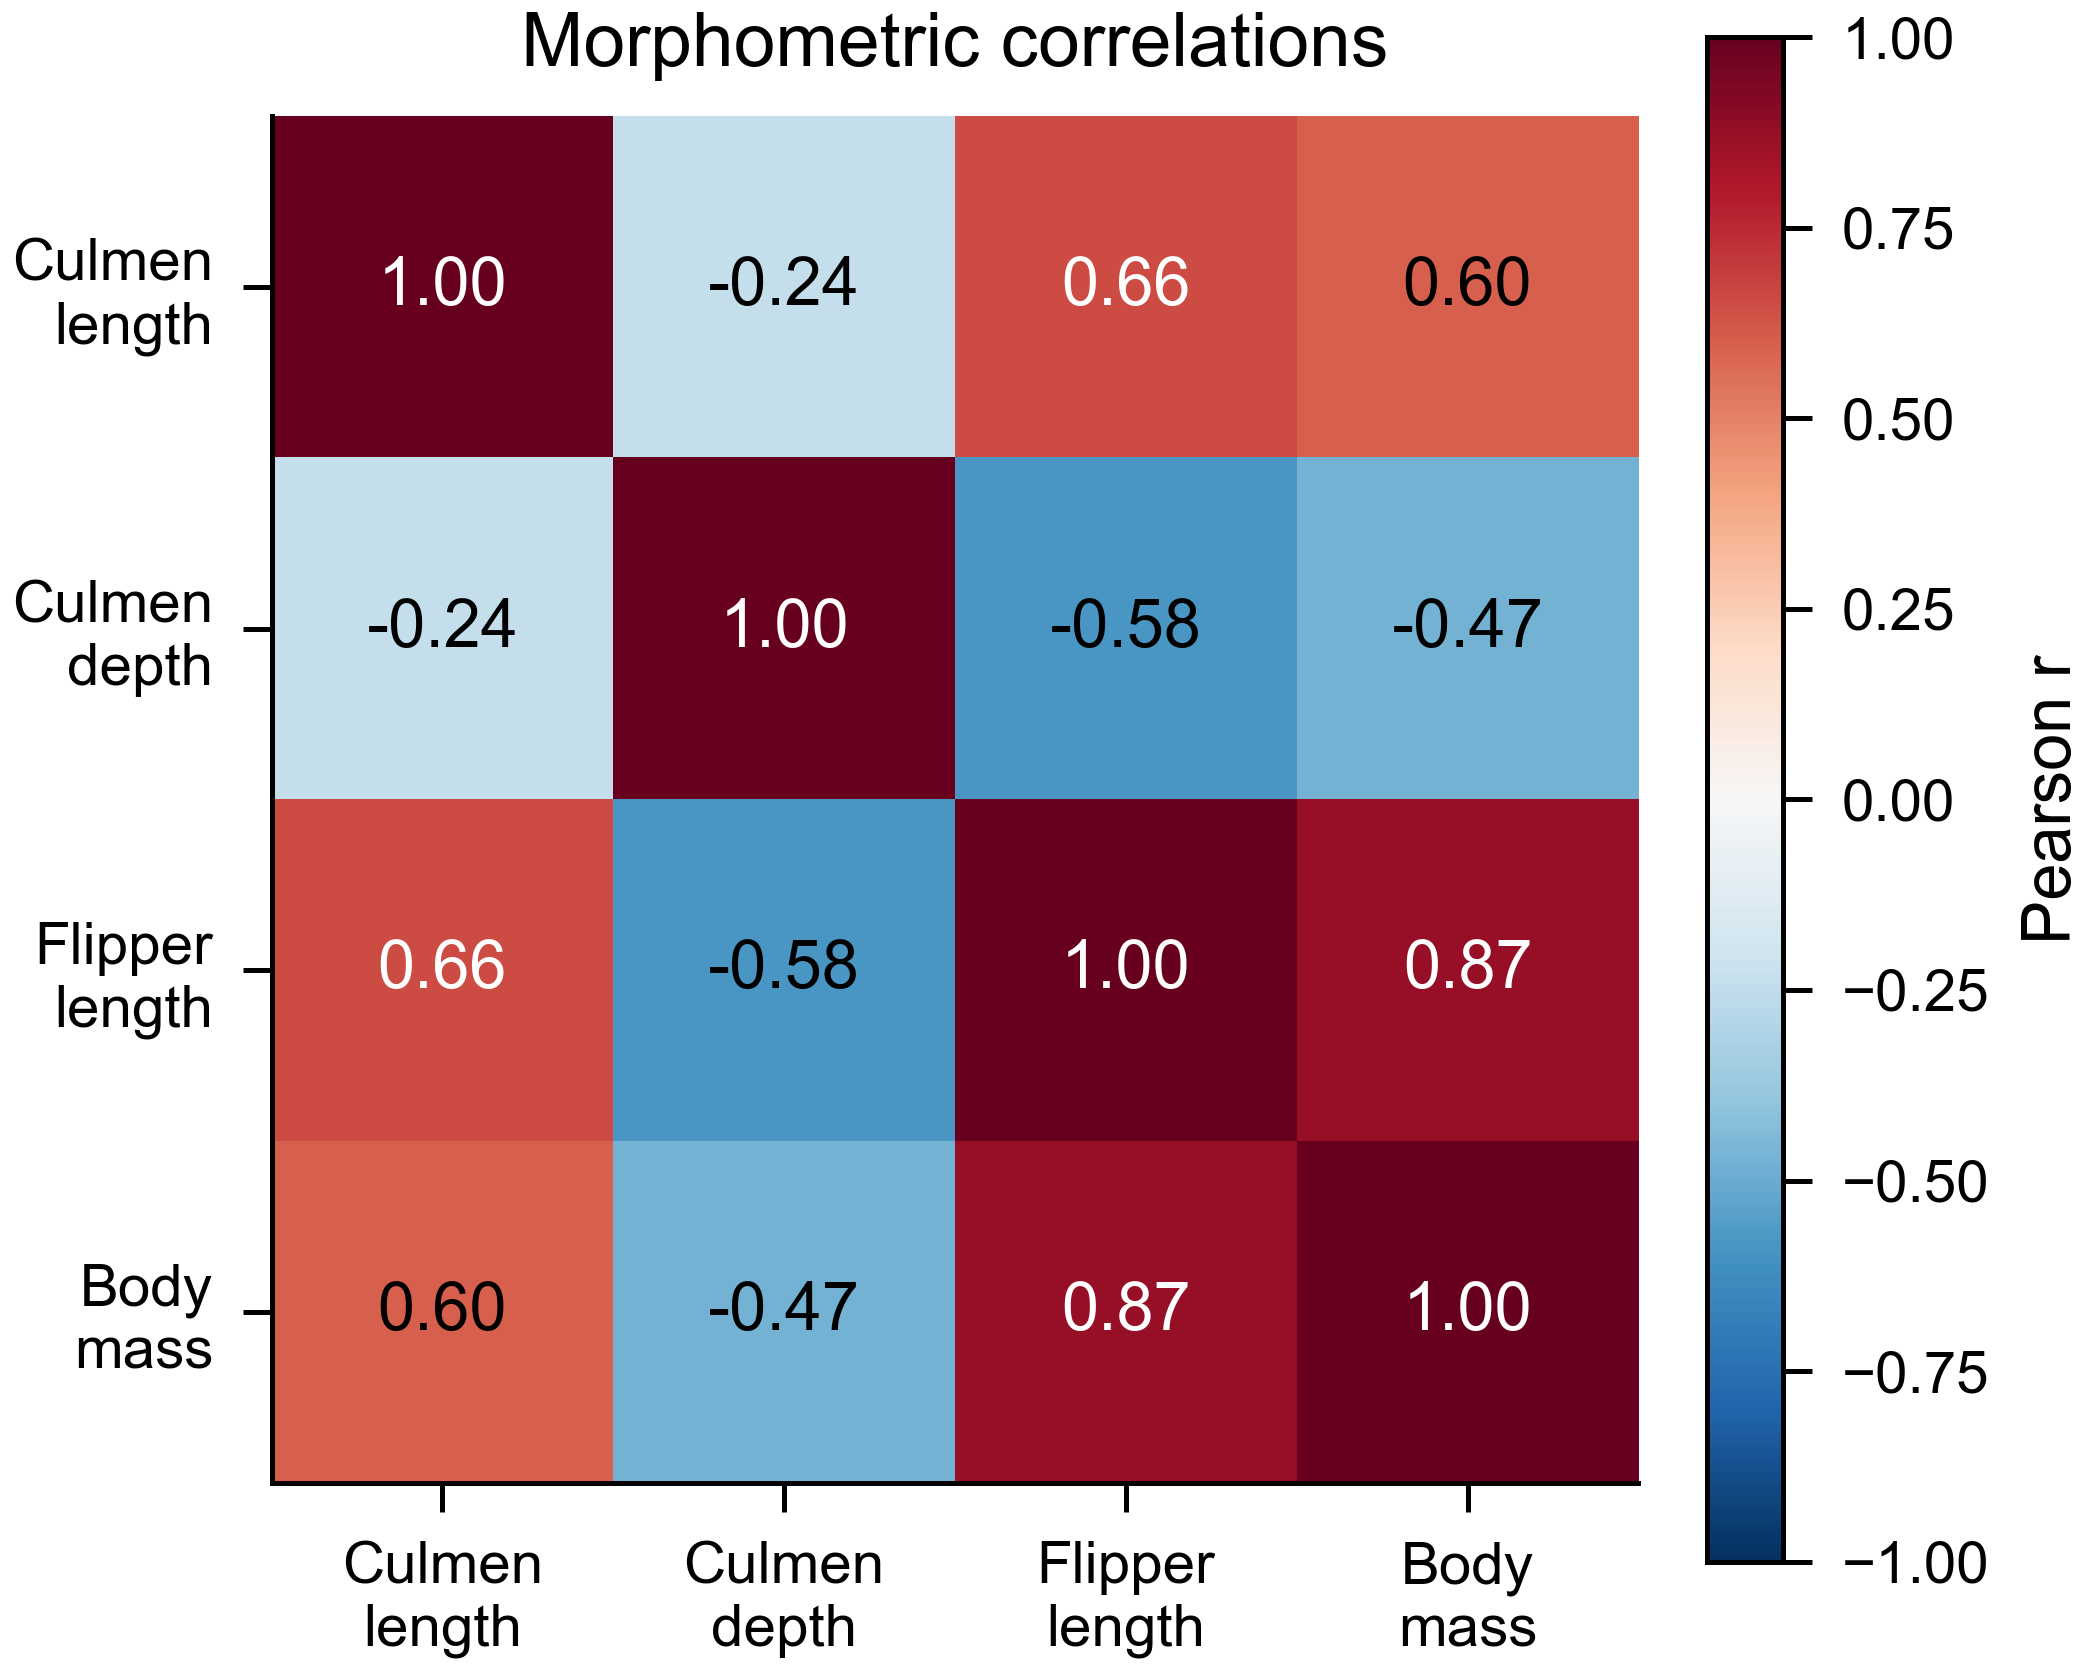
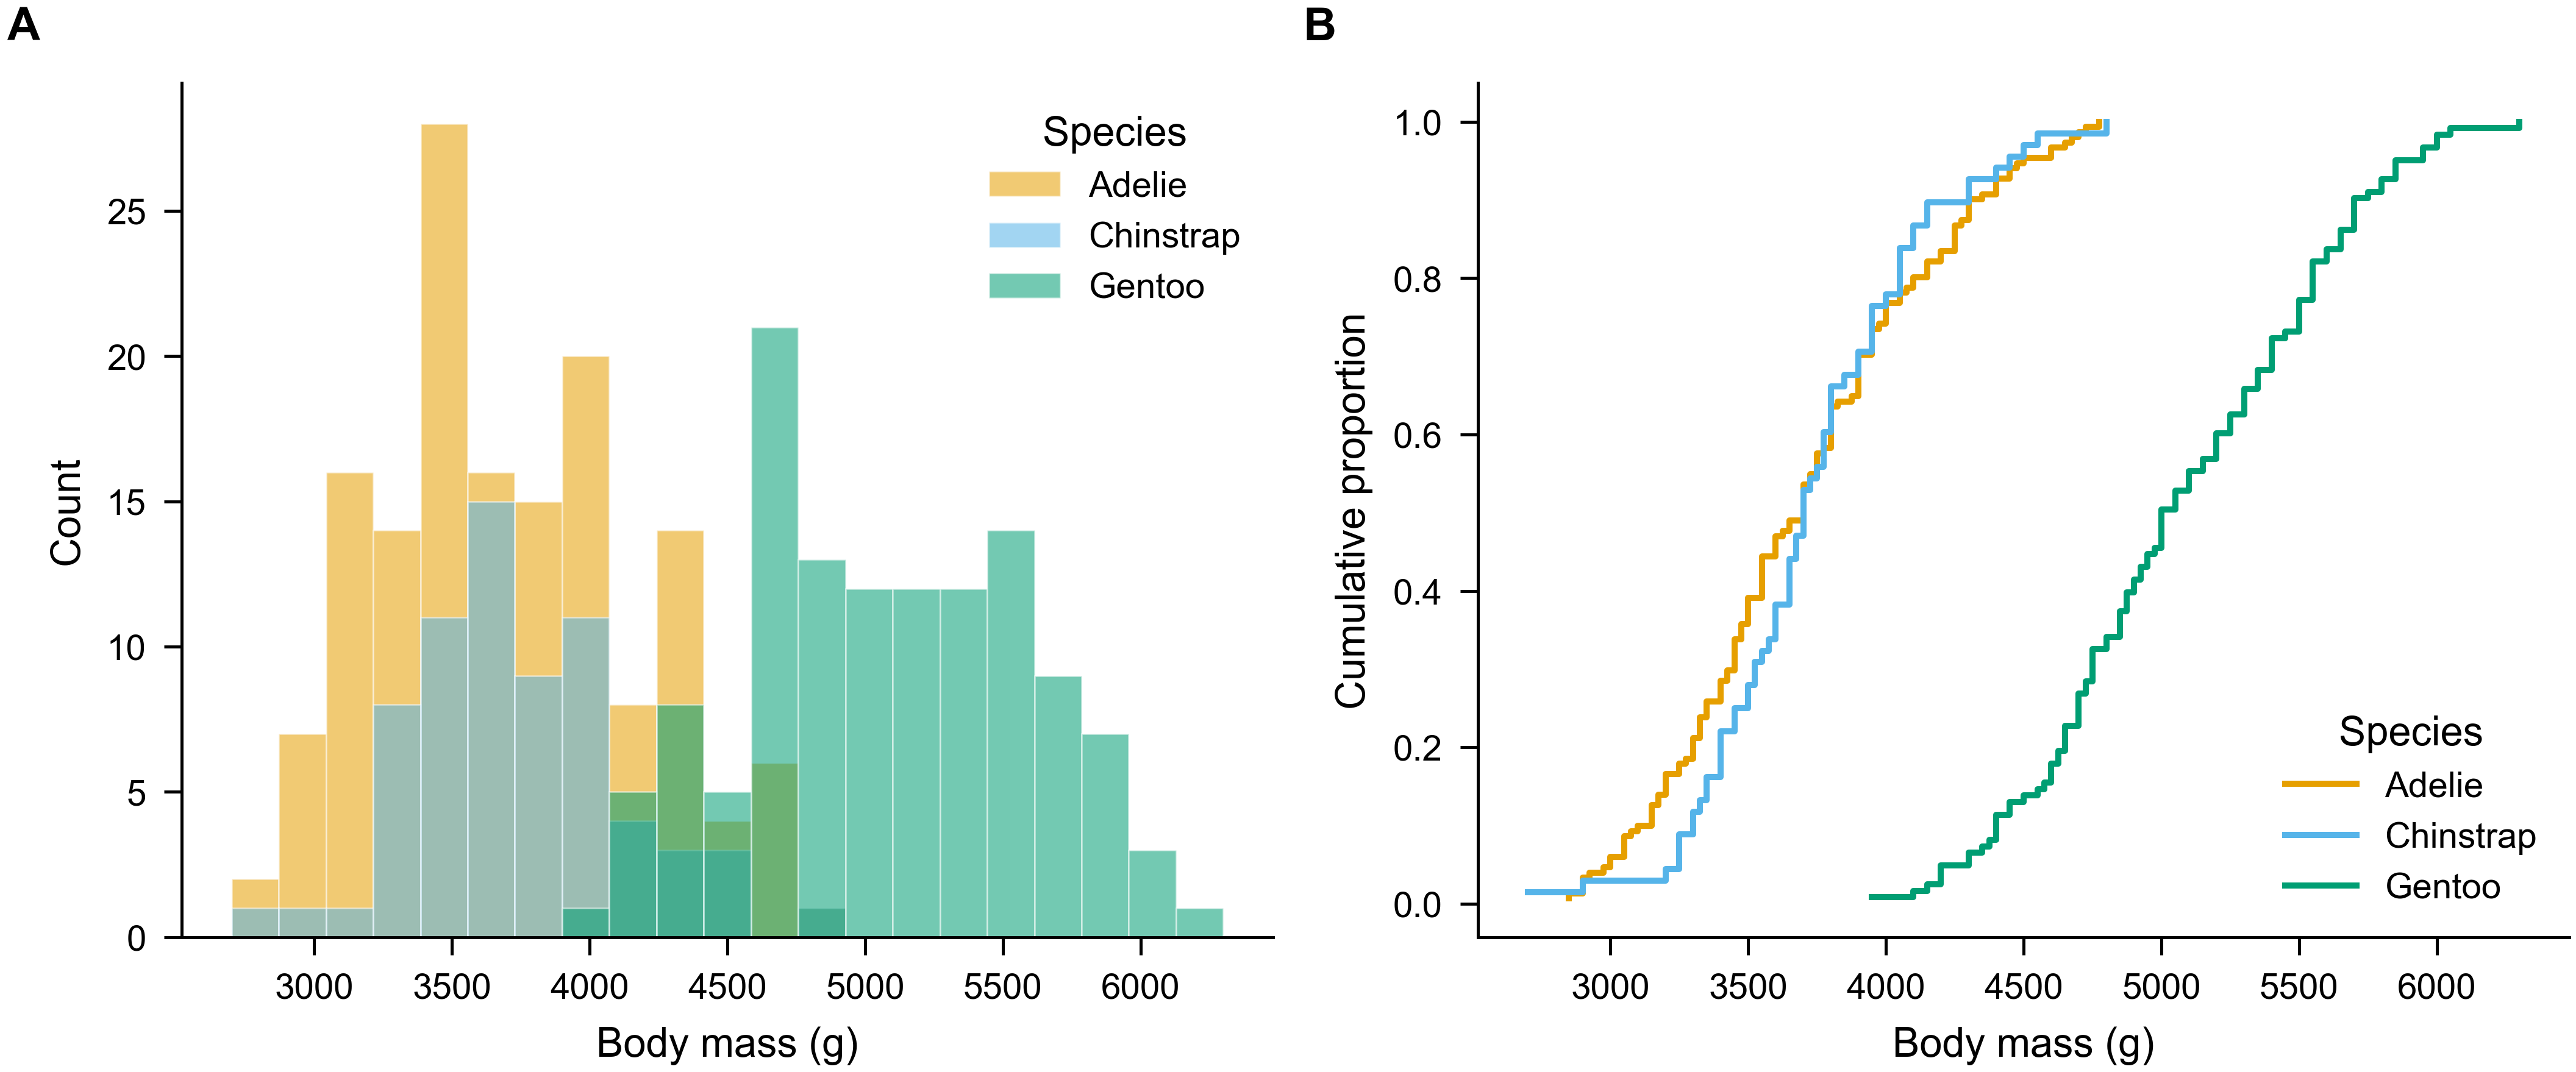
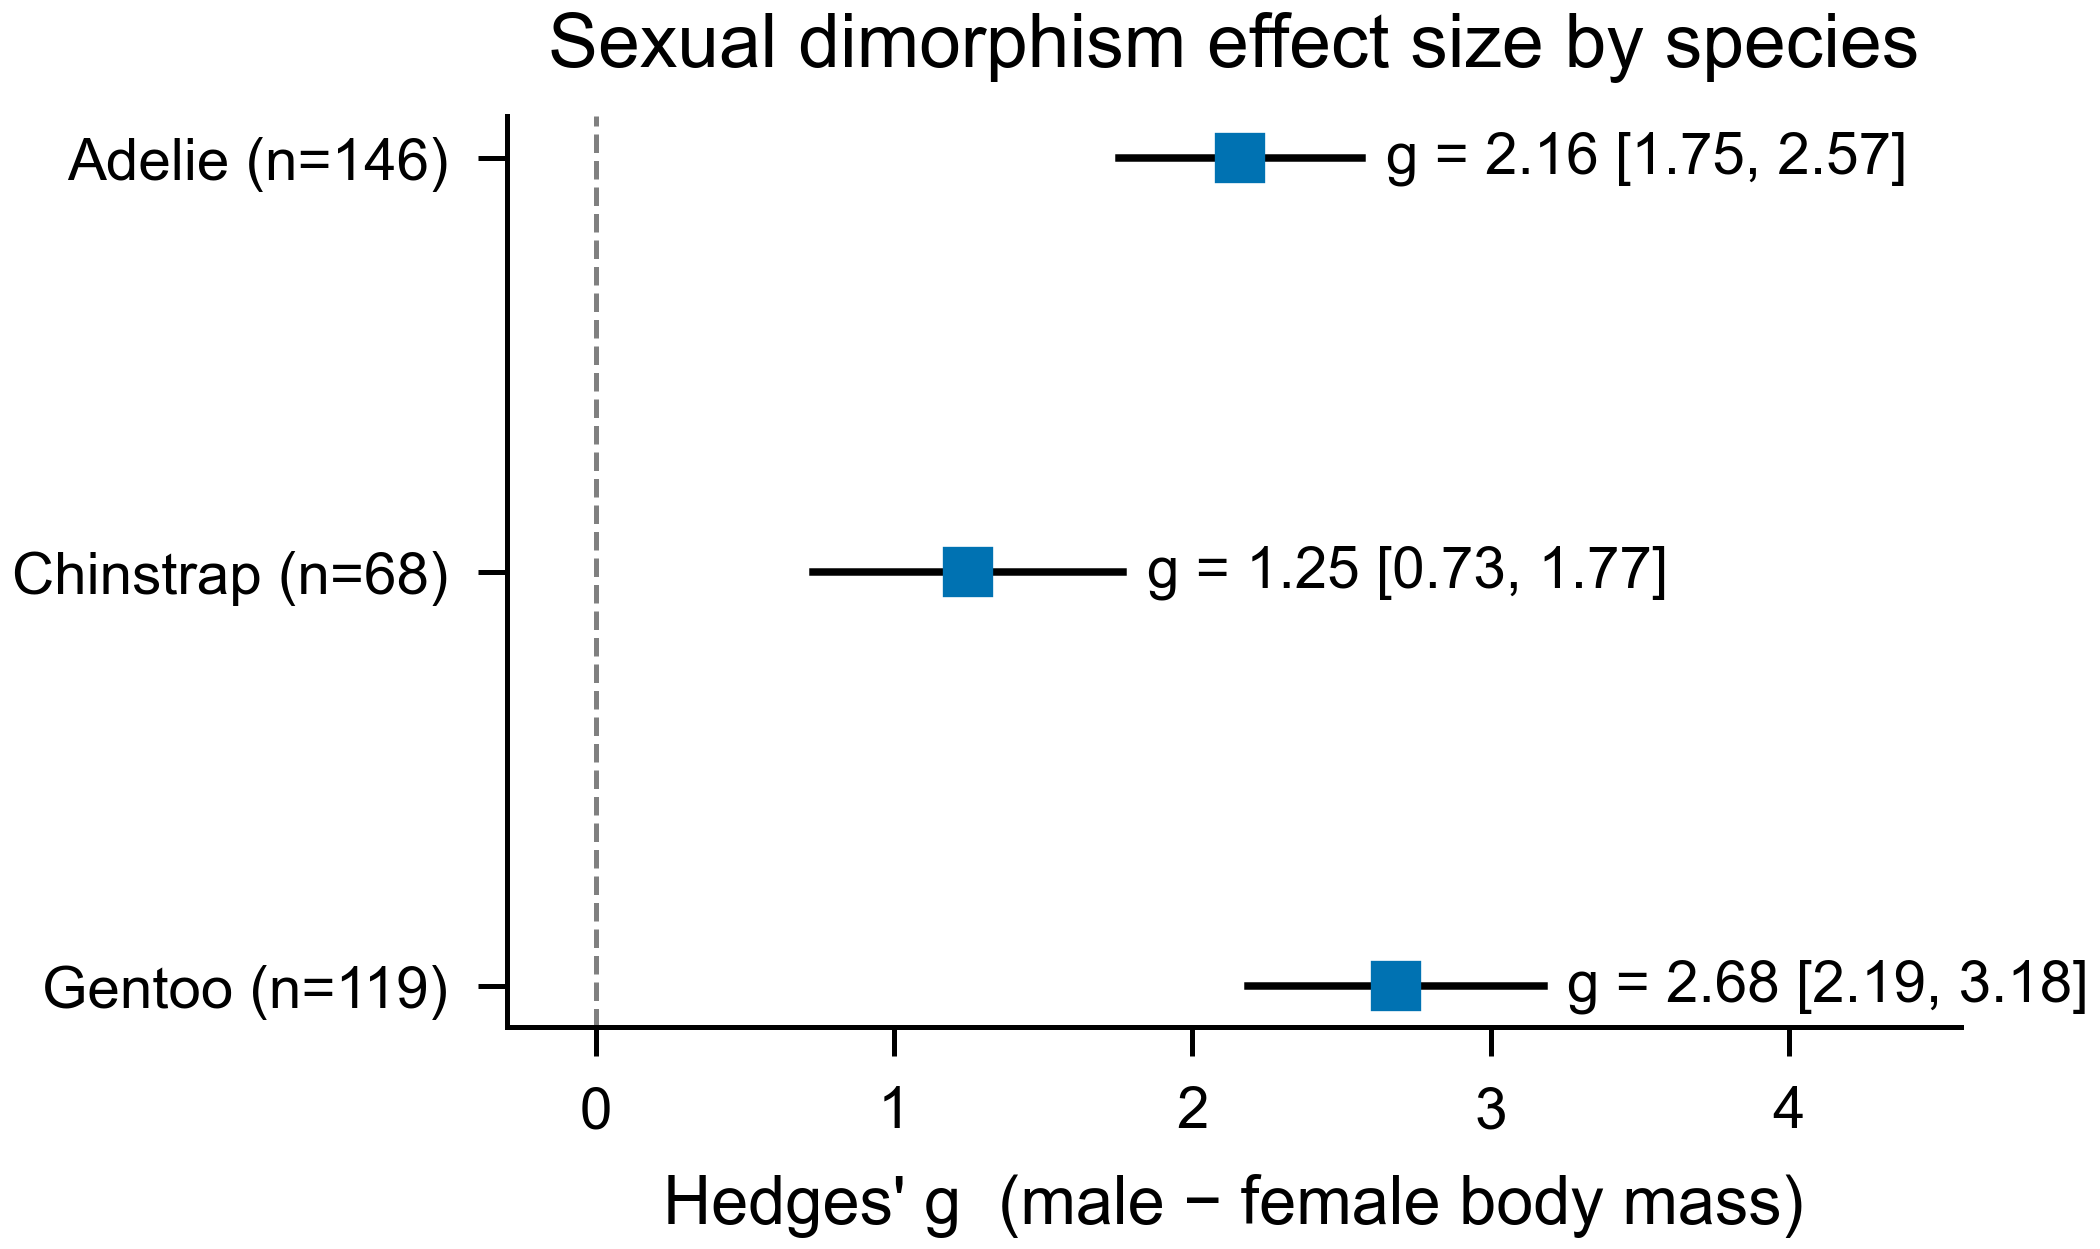
🐧 Example 1 — Chart variety (Antarctic penguins)
9 figures across 9 chart families + 3 three-line tables · explore ↗ · 📄 report
| Scatter + regression | Raincloud | PCA biplot |
|---|---|---|
 |  |  |
| Correlation heatmap | Histogram + ECDF | Forest plot |
 |  |  |
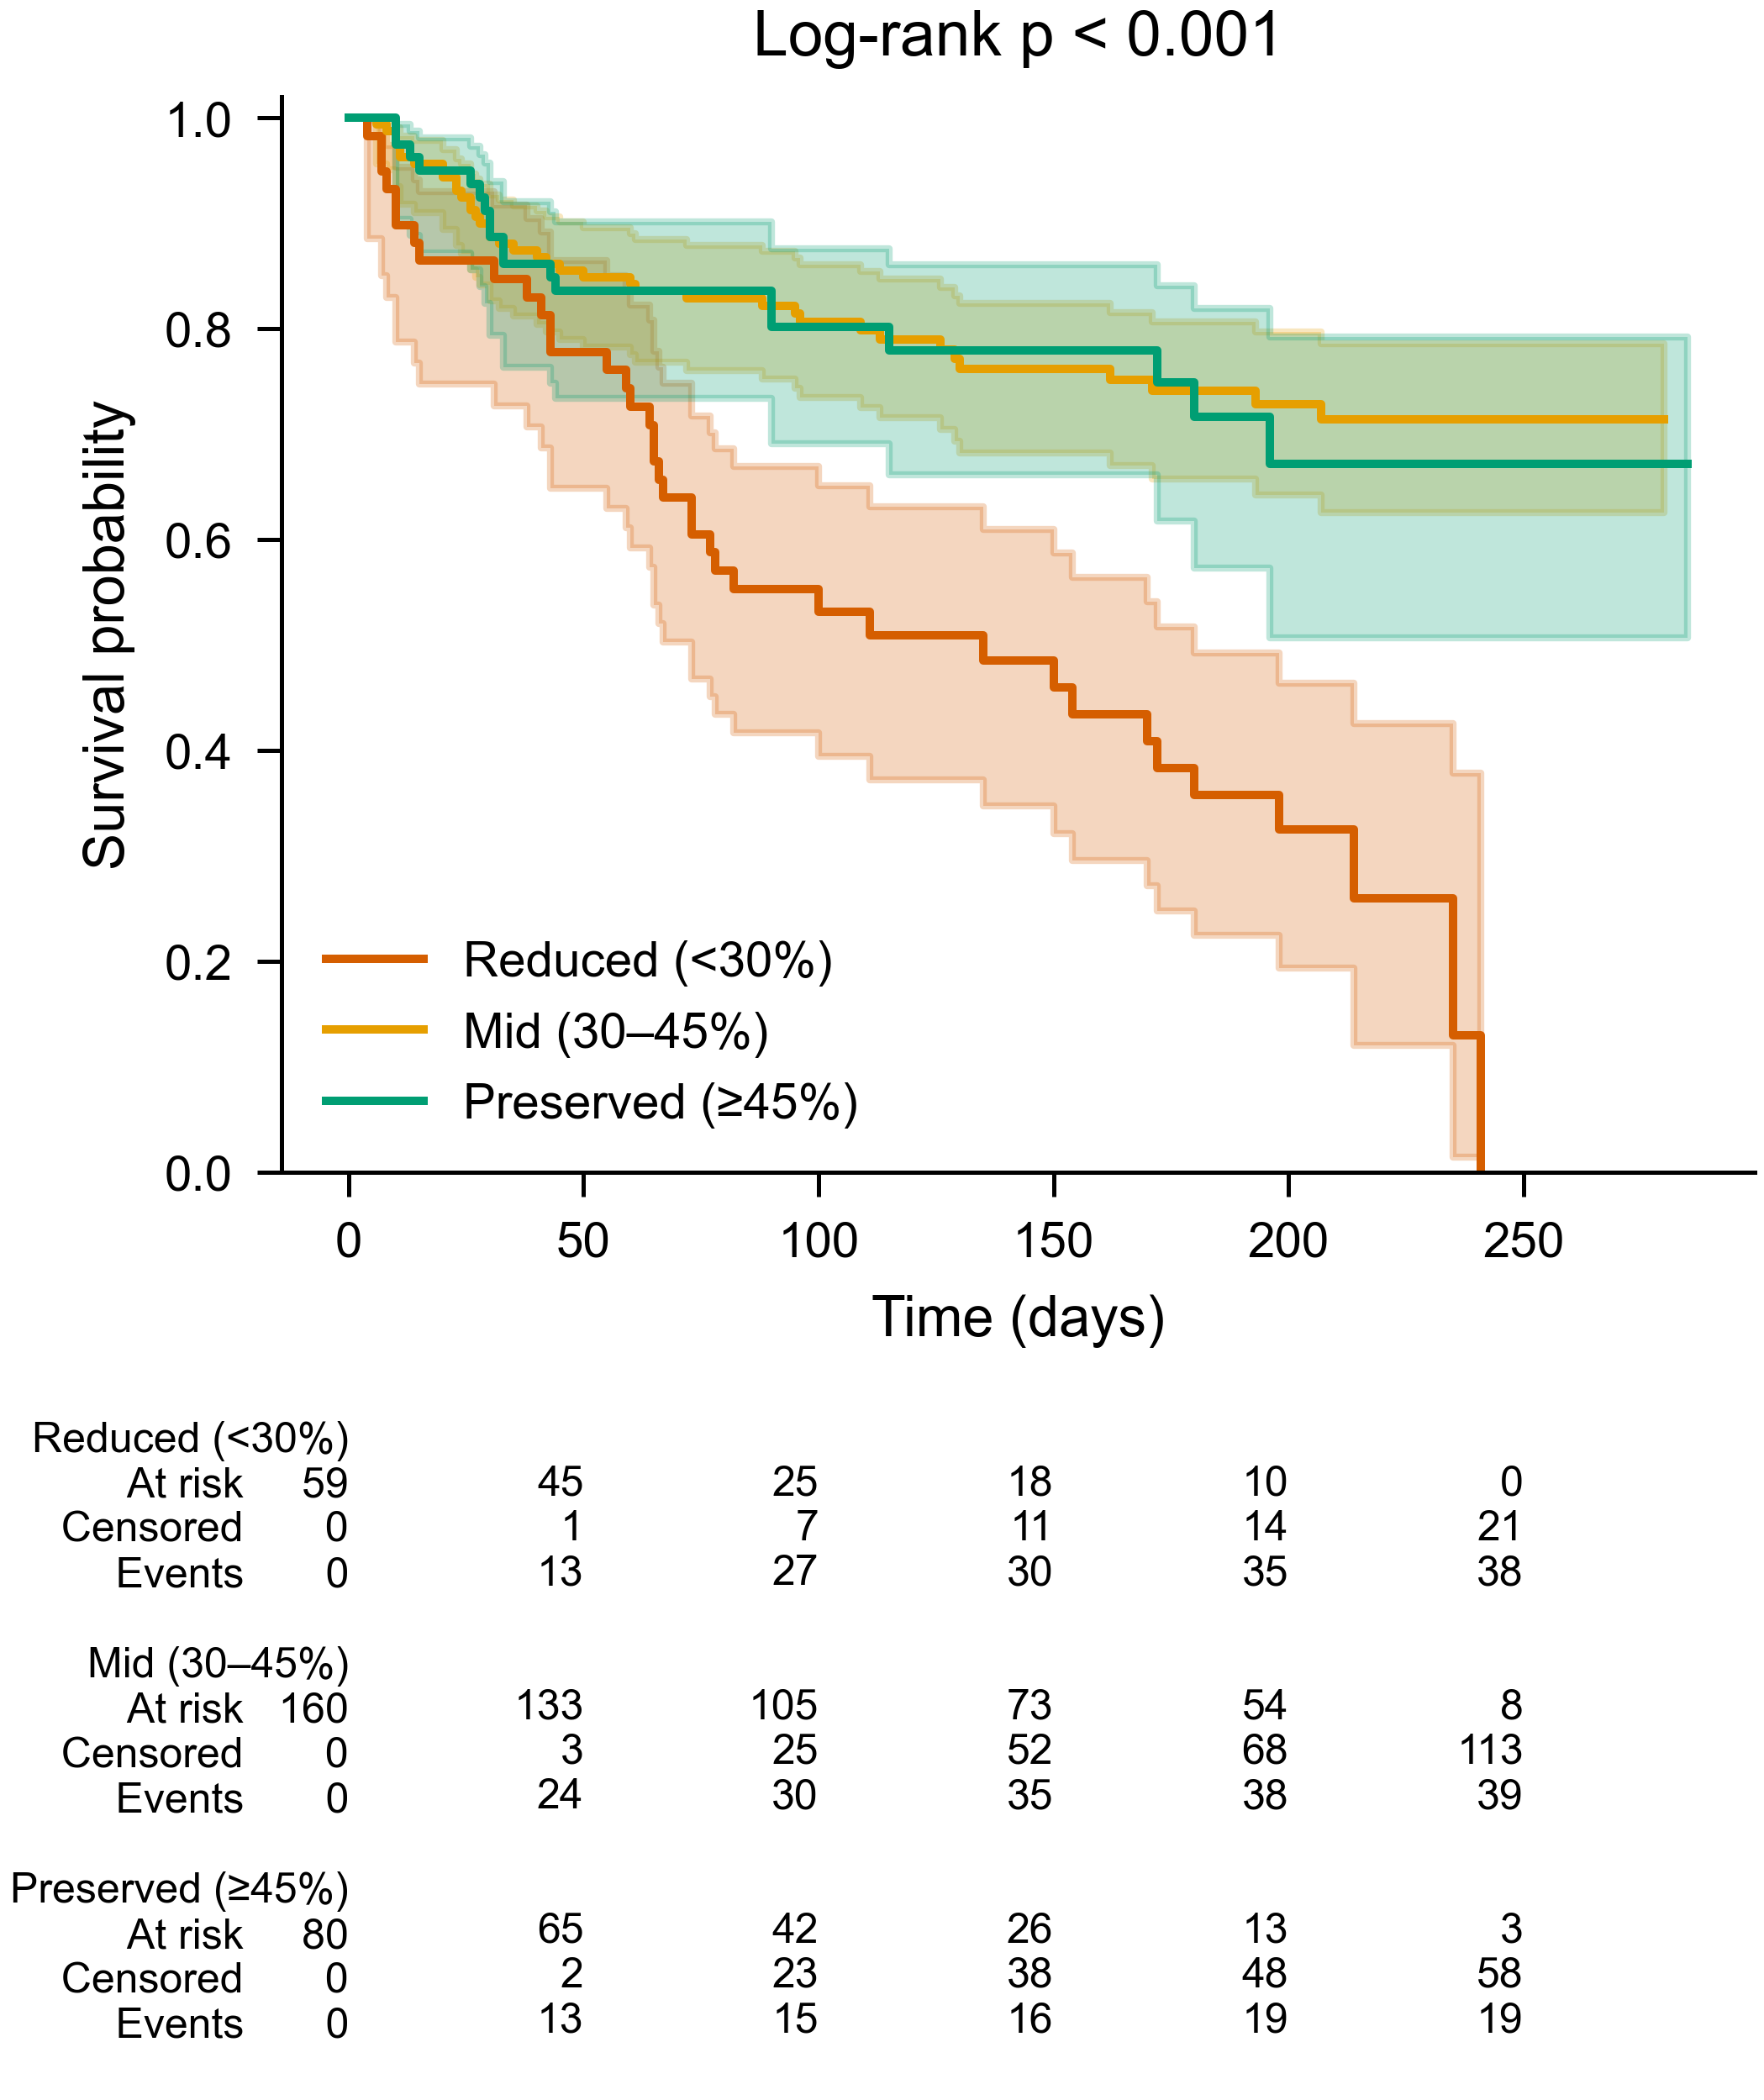
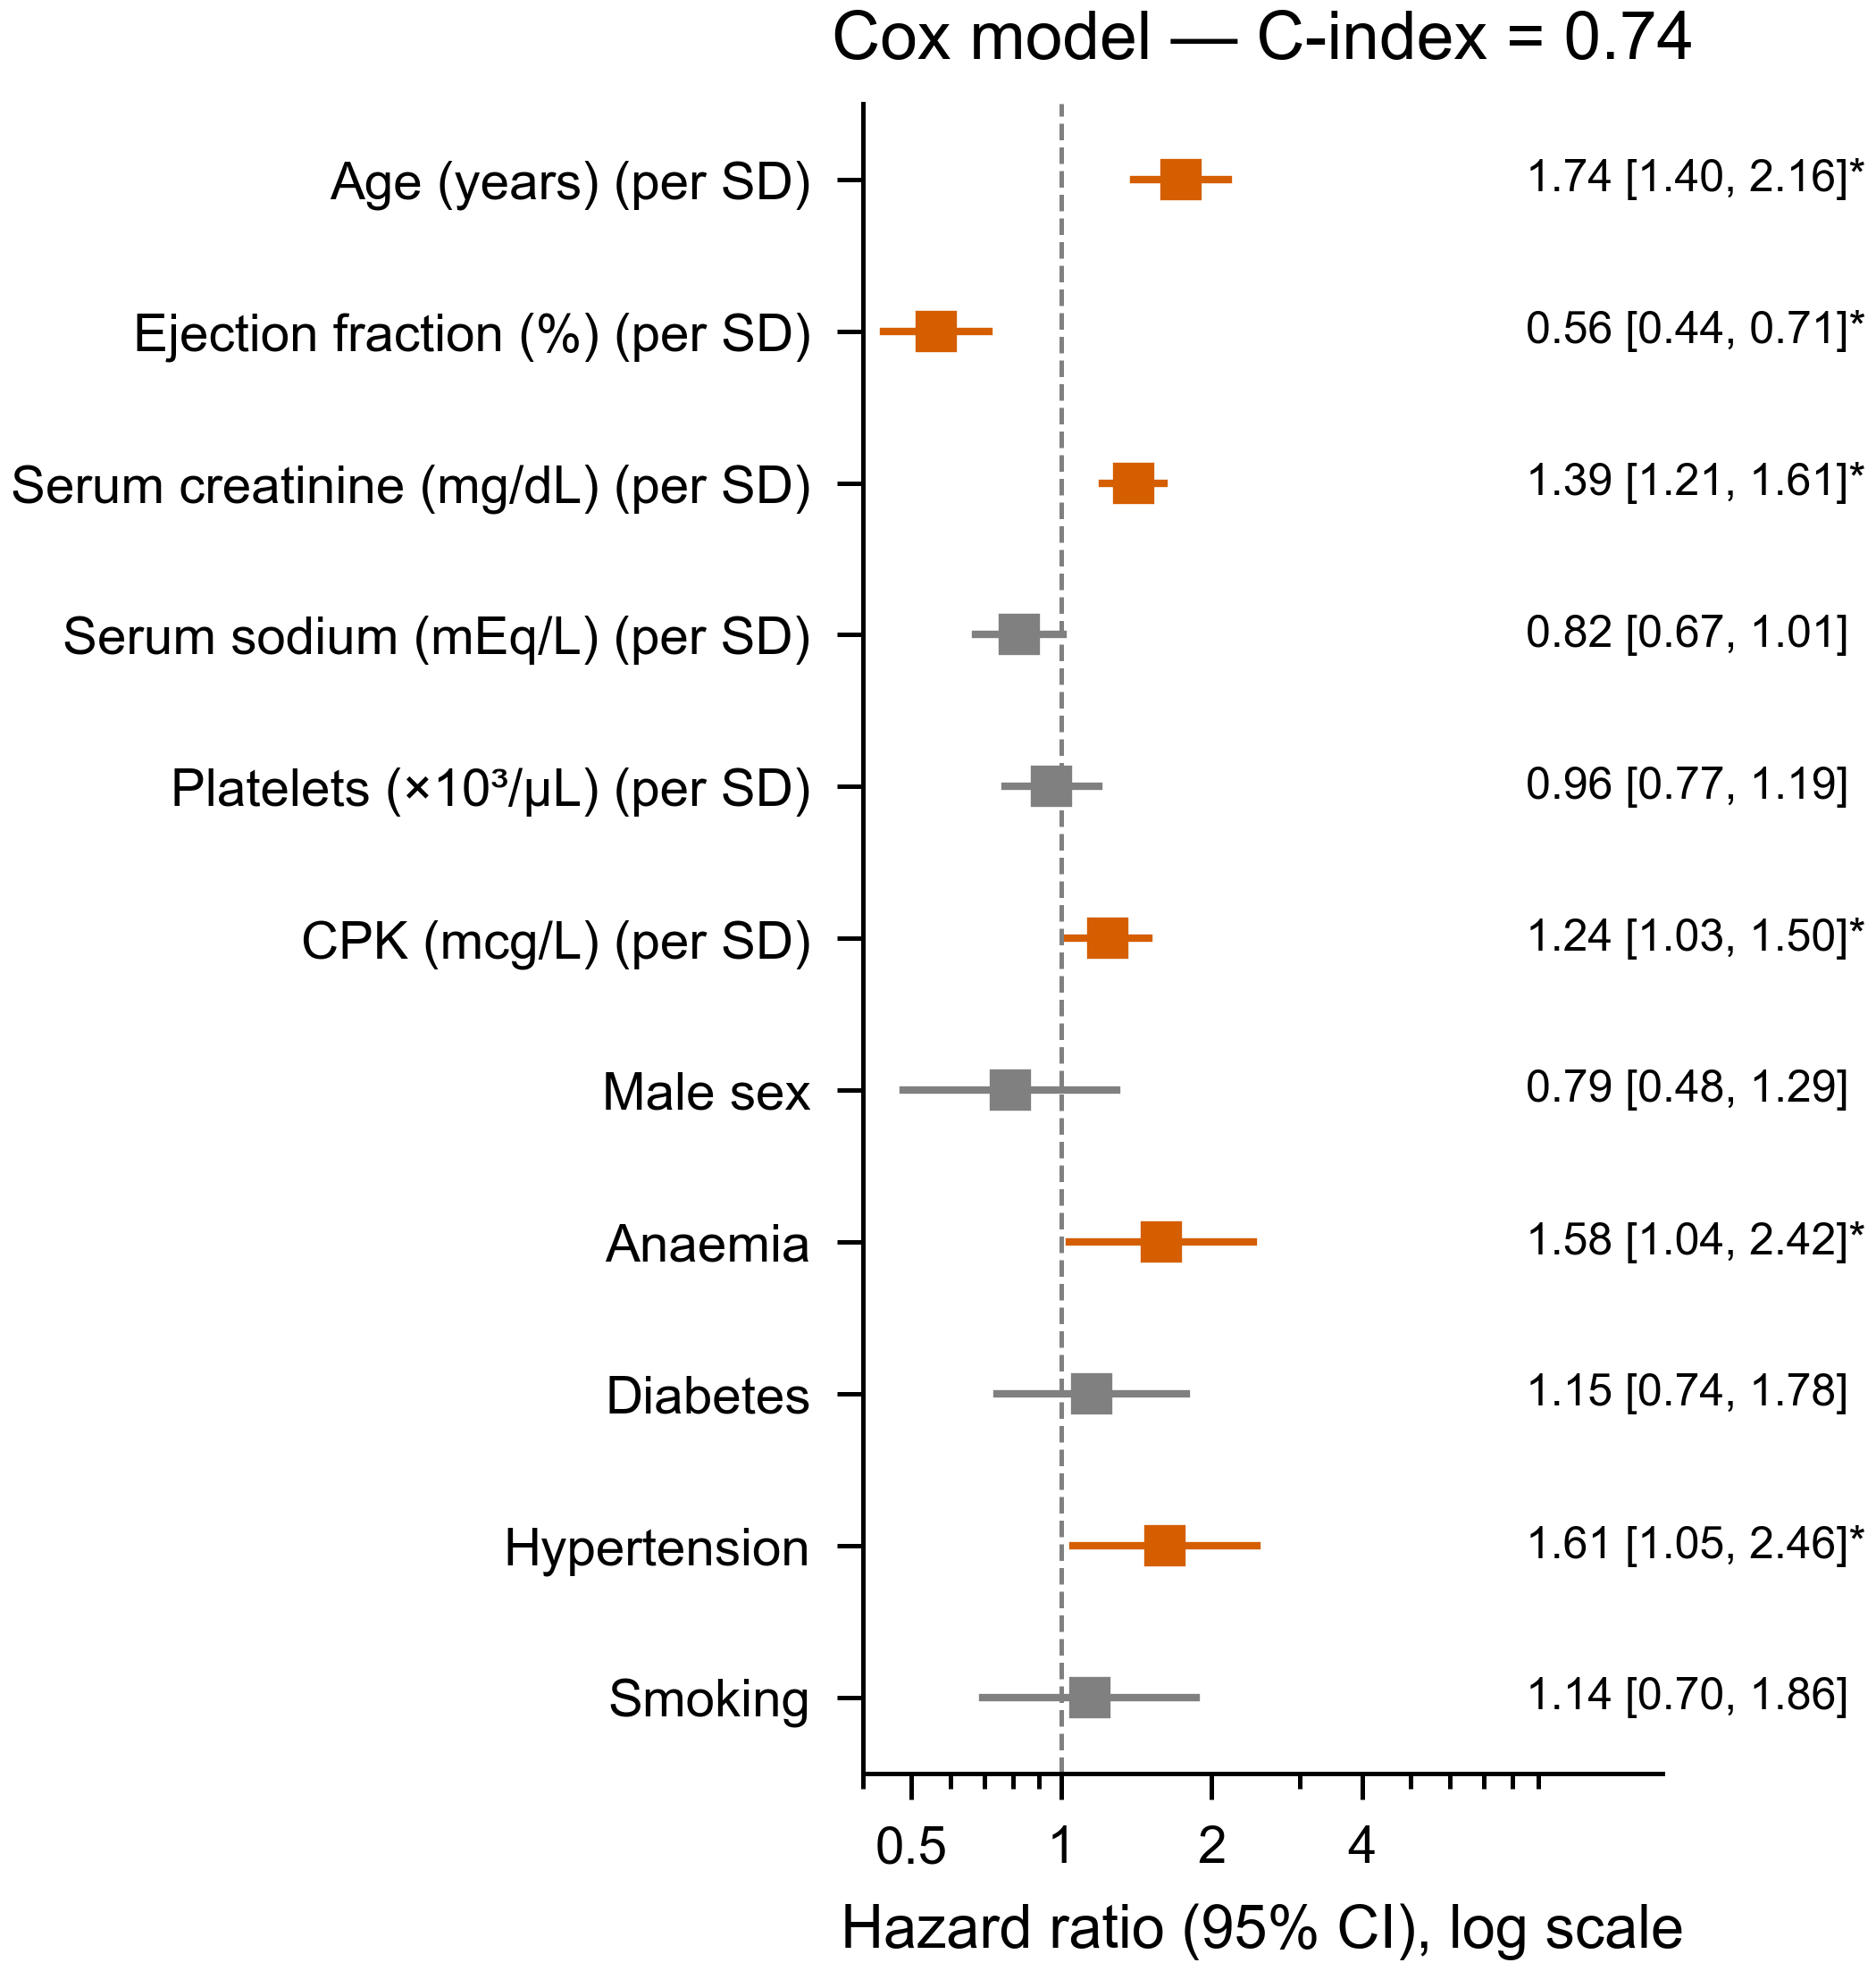
🫀 Example 2 — Statistical depth (heart-failure survival)
Kaplan–Meier · Cox regression · cross-validated ROC + 2 three-line tables · explore ↗ · reports: EN · bilingual · 中文
| Kaplan–Meier + risk table | Cox hazard ratios | Cross-validated ROC |
|---|---|---|
 |  | 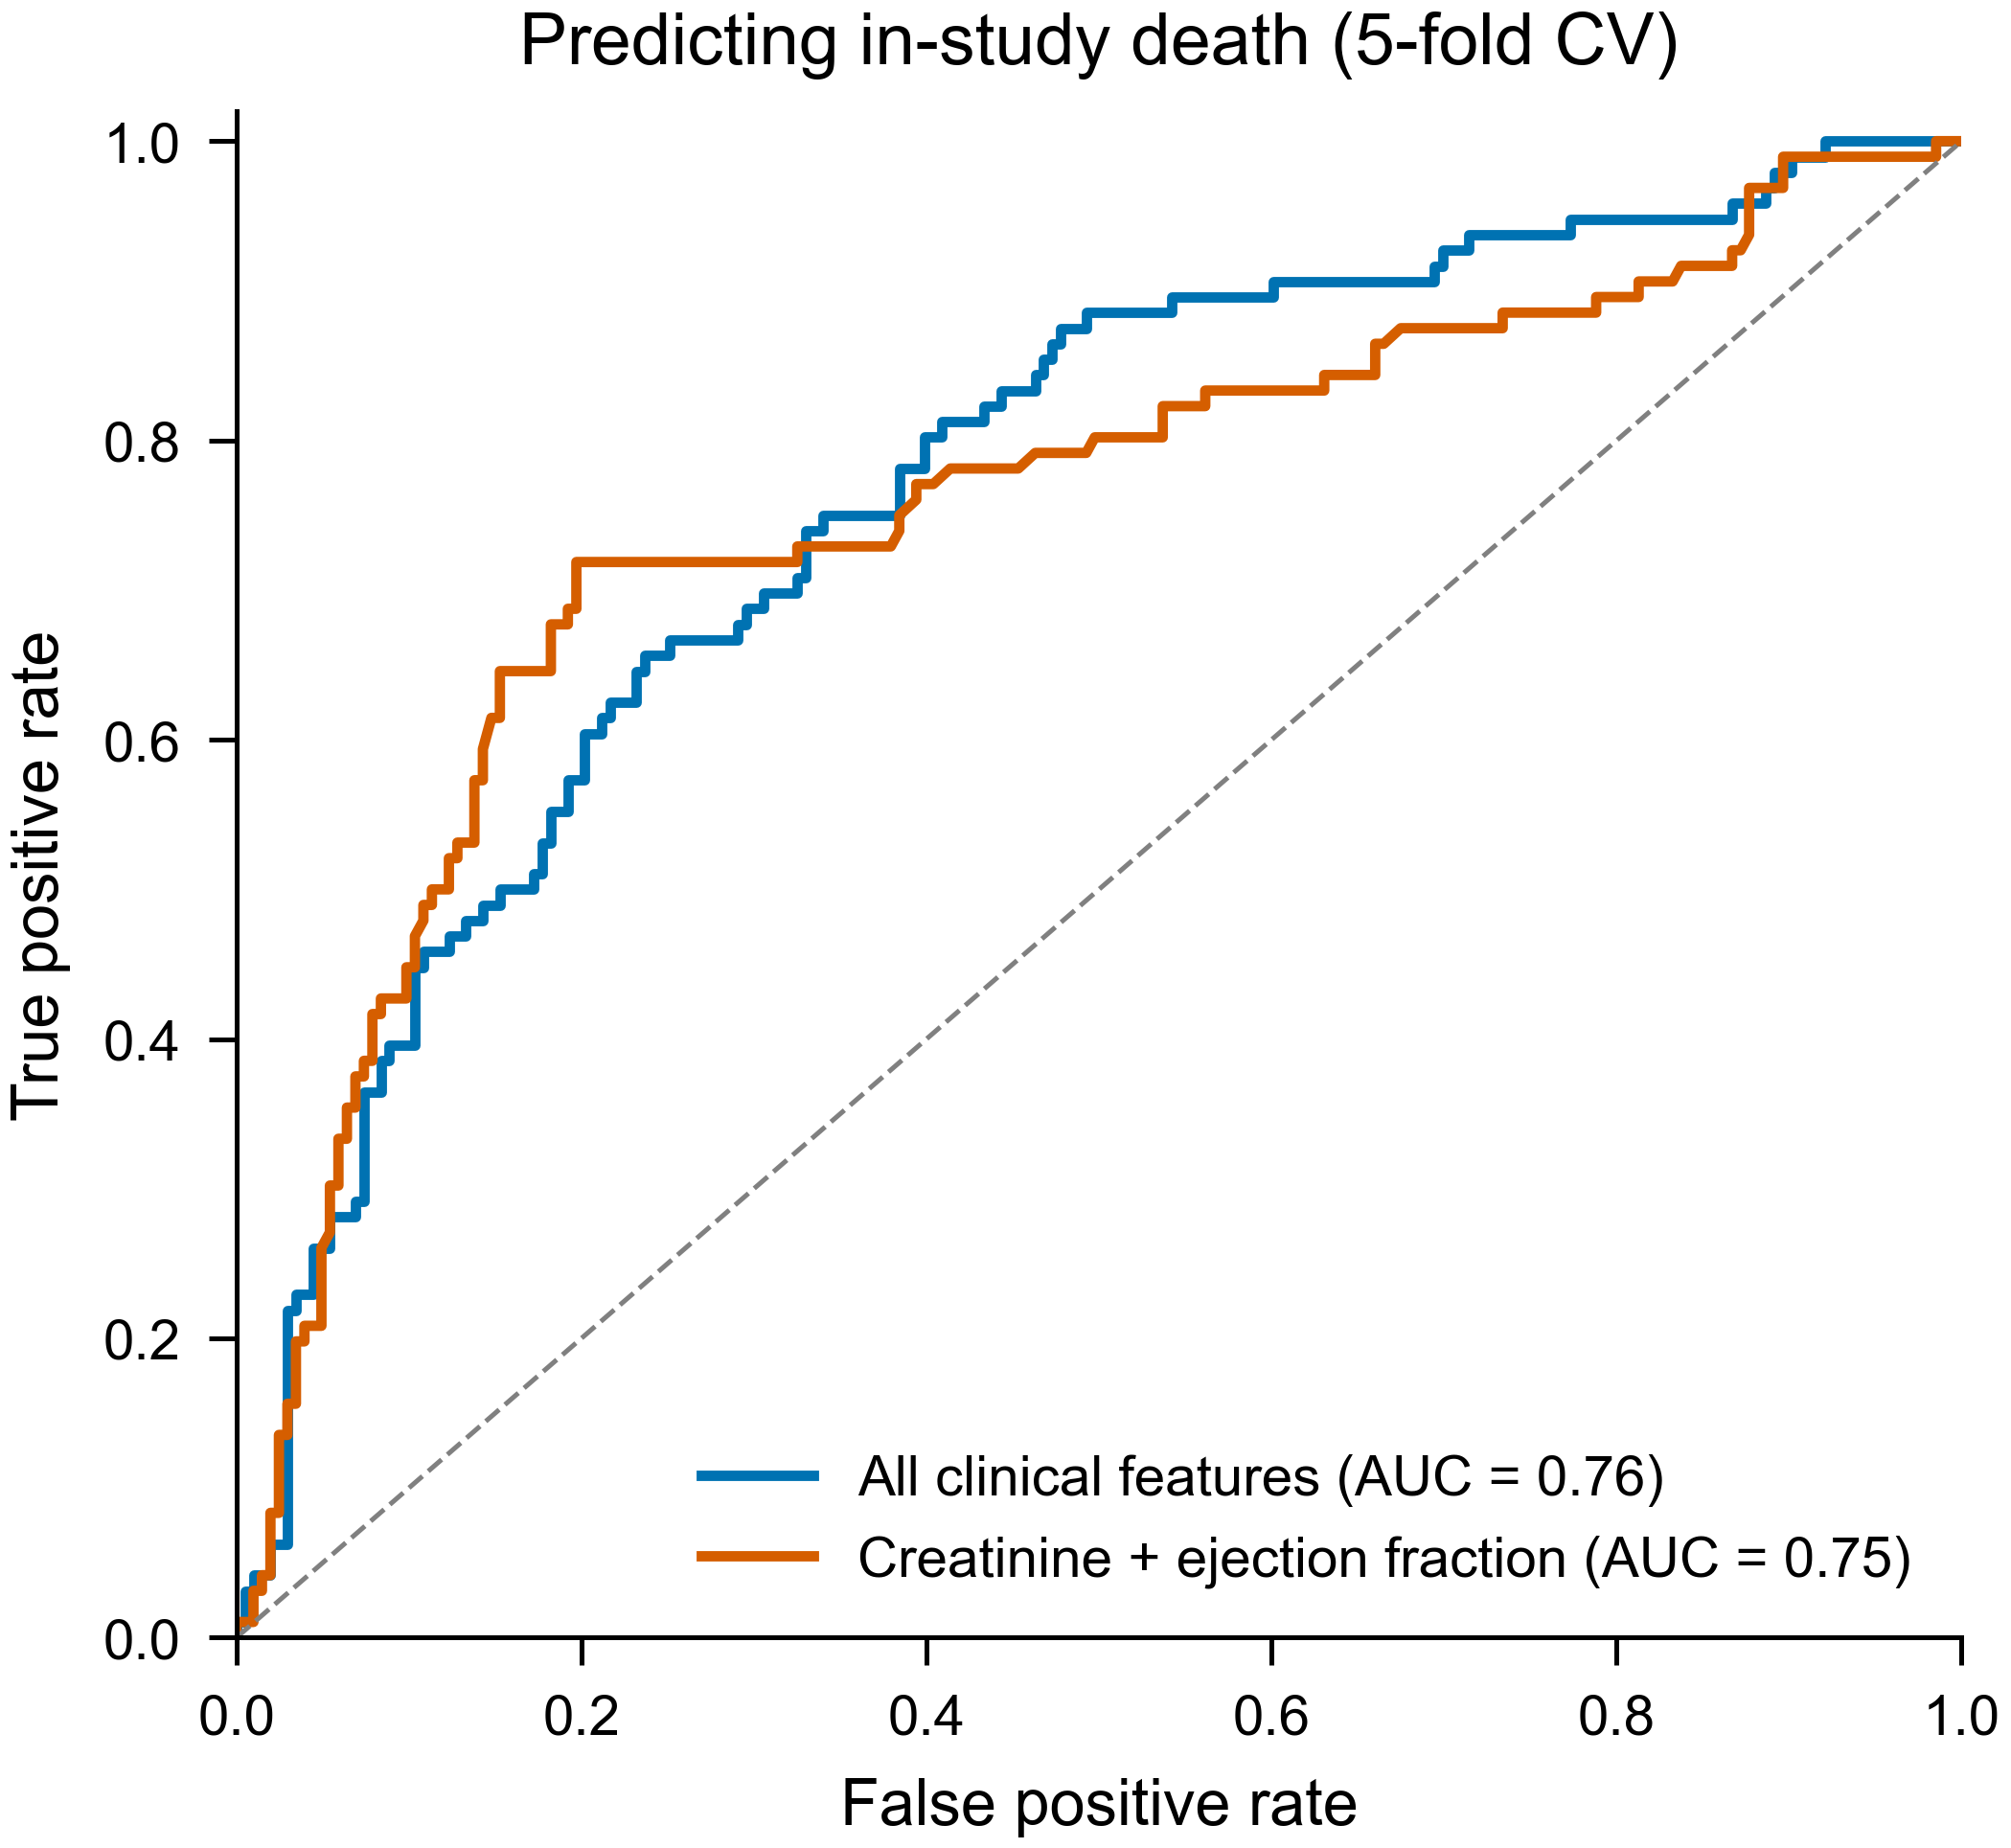 |
🎯 The 7-stage workflow
The skill is a disciplined workflow, not a one-shot prompt — the same path a careful analyst takes.
| Stage | What happens | |
|---|---|---|
| 1️⃣ | Read the paper | Understand the study; list every place a figure/table would strengthen it. |
| 2️⃣ | Frame the figure | One sentence: "This figure shows that ___." Then locate the exact raw data. |
| 3️⃣ | Analyze & decide | Pick the statistic + chart from the data's shape and the claim. |
| 4️⃣ | Check standards | Apply the target journal's preset (size, fonts, dpi, format). |
| 5️⃣ | Plot | Write & run Python to render the real figure. |
| 6️⃣ | Self-check | Open the rendered image and verify the loop closes — labels, units, n, significance. |
| 7️⃣ | Export & report | Numbered assets + a Word report (captions, annotations, citation locations) in your chosen language. |
💪 Why it's different
| Typical "make me a chart" | paper-figures | |
|---|---|---|
| Source | screenshots / made-up numbers | your raw data, via runnable code |
| How it's made | sometimes a generative image model guessing pixels | statistical computation + plotting code; every pixel traces to your data |
| Chart choice | whatever's default | matched to data shape + claim |
| Statistics | often skipped or wrong | design-appropriate tests, computed, reported |
| Honesty | truncated axes, hidden n | enforced: zero-baseline bars, stated n & error |
| Journal fit | manual fiddling | one preset, applied consistently |
| Self-review | none | reads its own rendered image before exporting |
| Deliverable | a PNG | numbered vector + raster + a Word report |
| Reproducible | no | fixed seeds + saved scripts |
🌐 Output language
Tell your agent which language you want the captions, annotations and report in — or let it infer from your manuscript:
- English only — international journal / English manuscript
- 中文 only — Chinese thesis or journal
- Bilingual — captions in both (great while drafting or for a bilingual team)
See the heart-failure example for the same report rendered in English, bilingual, and in Chinese.
🚀 Install & deploy
It's a self-contained Agent Skill — the paper-figures/ folder holds a standard SKILL.md
(YAML + Markdown) plus Python scripts and assets, with no agent-specific runtime. The same folder
drops into any major agent that supports skills.
1. Get the skill:
git clone https://github.com/DRZ-hang/paper-figures.git
2. Put the paper-figures/ folder where your agent looks for skills:
- Claude Code —
~/.claude/skills/(all projects) or a project's.claude/skills/:cp -r paper-figures/paper-figures ~/.claude/skills/ # Windows PowerShell: # Copy-Item -Recurse paper-figures\paper-figures $env:USERPROFILE\.claude\skills\ - OpenAI Codex — copy the folder into Codex's skills directory (see your Codex setup's skills docs for the exact path).
- Other skill-capable agents — drop the same
paper-figures/folder into that agent's skills location. Because the skill is justSKILL.md+ scripts, one folder works everywhere; only the destination directory differs per agent.
3. Install the Python dependencies:
pip install -r paper-figures/requirements.txt
Once installed, the skill triggers when you ask the agent to make figures or tables for a paper.
Run
python paper-figures/scripts/figstyle.py --listto see the bundled journal presets.
📝 Usage
Just describe the task to your agent with your manuscript and data at hand:
- "Here's my manuscript and
results.xlsx— make the figures for the Results section, formatted for Nature, captions in English."- "为这篇论文的实验数据画一张分组比较图,目标期刊是 IEEE 双栏,图注用中文。"
- "Turn
cohort.csvinto a Kaplan–Meier figure and a baseline characteristics table (三线表), bilingual report."
Your agent reads the paper, proposes a figure/table plan, picks the statistics and chart type, applies the journal preset, renders with Python, self-checks the image, exports the numbered assets, and gives you the Word report in your chosen language.
📦 What's in the box
paper-figures/                     ← the skill (install this folder)
├── SKILL.md                       ← the workflow the agent follows
├── requirements.txt
├── references/                    ← decision guides loaded on demand
│   ├── chart-selection.md         ·  data shape × claim → chart type
│   ├── statistical-methods.md     ·  choosing & reporting statistics
│   ├── journal-specs.md           ·  journal requirements + preset system
│   └── plotting-stacks.md         ·  matplotlib / seaborn / plotnine / plotly idioms
├── scripts/
│   ├── figstyle.py                ·  apply journal preset + export figures
│   ├── docx_tables.py             ·  three-line (三线表) Word tables
│   └── report_docx.py             ·  assemble the report (lang = en / zh / bilingual)
└── assets/
    ├── presets.json               ·  editable journal presets
    └── report_template.md         ·  Markdown report fallback

examples/                          ← two full worked examples (data + scripts + figures + reports)
├── penguins-sexual-dimorphism/    ·  9 chart families, 3 tables
└── heart-failure-survival/        ·  survival / Cox / ROC, 2 tables, reports in 3 languages
🔬 Reproducibility
Every figure and table in this repo is produced solely by running the scripts in
examples/*/scripts/. Random seeds are fixed, so re-running reproduces the exact output, and the
statistics have been independently re-derived from the raw data and verified.
cd examples/penguins-sexual-dimorphism/scripts
for f in make_*.py; do python "$f"; done   # regenerates every figure, table & the report

# pick a report language for the heart-failure example:
cd ../../heart-failure-survival/scripts
PAPERFIG_LANG=en python make_report.py      # or zh / bilingual
⚠️ Disclaimer
paper-figures assists with analysis and figure/table production from your data; it does not replace scientific judgement. Research publishing demands rigour, and the authors of the paper remain fully responsible for the work. Before using or submitting any figure or table, have the authors review the statistical methods, the chart choices, the underlying numbers, and the wording of every caption for professional correctness and accuracy. Treat the output as a well-prepared draft to verify, and sign off on it only after that expert review.
📄 License & data attribution
This project's code is released under the MIT License.
The two worked examples are built entirely from other researchers' published, openly-licensed data. All credit for the data belongs to the original authors below — please keep this attribution if you reuse the examples.
🐧 Example 1 — Antarctic penguins
Paper (CC BY 4.0): Gorman KB, Williams TD, Fraser WR (2014). Ecological Sexual Dimorphism and Environmental Variability within a Community of Antarctic Penguins (Genus Pygoscelis). PLOS ONE 9(3): e90081. https://doi.org/10.1371/journal.pone.0090081
Data (CC0): collected by Dr. Kristen Gorman and the Palmer Station Antarctica LTER (PAL-LTER); distributed via the
palmerpenguinsR package — Horst AM, Hill AP, Gorman KB (2020). https://allisonhorst.github.io/palmerpenguins/ · doi:10.5281/zenodo.3960218
🫀 Example 2 — Heart-failure survival
Paper (CC BY 4.0): Chicco D, Jurman G (2020). Machine learning can predict survival of patients with heart failure from serum creatinine and ejection fraction alone. BMC Medical Informatics and Decision Making 20: 16. https://doi.org/10.1186/s12911-020-1023-5
Original data collection: Ahmad T, Munir A, Bhatti SH, Aftab M, Raza MA (2017). Survival analysis of heart failure patients: A case study. PLOS ONE 12(7): e0181001. https://doi.org/10.1371/journal.pone.0181001
Dataset (CC BY 4.0): UCI Machine Learning Repository, Heart failure clinical records (dataset 519). https://archive.ics.uci.edu/dataset/519/heart+failure+clinical+records
Per-example details and license notes: penguins · heart failure.
** If this helps your research, please ⭐ the repo.