
ShipGuard
bacoco/ShipGuard
Claude Code skills for automated E2E testing with agent-browser (Playwright CLI). Discover routes, generate YAML test manifests, execute with hybrid LLM assertions, track regressions.
Instalação
npx convez-ai bacoco/ShipGuard1 comando no terminal: detecta o formato do repositório (marketplace ou plugin avulso) e instala via Claude Code. Requer Node 18+ e o Claude Code instalado.
Métricas
README
A tradução para o português deste README ainda está na fila.
ShipGuard

Ship with confidence. ShipGuard finds bugs before your users do — and gets smarter every time.
How it works

code audit → find bugs → visual test → confirm on screen → human review → annotate → auto-fix → repeat
ShipGuard closes the loop between static analysis and visual reality. Code audit finds bugs in source. Visual tests verify if users see them. You annotate what matters. AI fixes it. The system learns and gets better each run.
Status
| Module | Status | Notes |
|---|---|---|
| Visual E2E Debugger | 🟢 Stable | discover → run → review → fix loop |
| Code Audit | 🟢 Stable | parallel agents, multi-round, verification |
| Macro Recorder | 🟢 Stable | record → replay via YAML manifests |
| Self-Improving Engine | 🟡 Experimental | sg-improve + sg-scout, evolving |
| Review Dashboard | 🟢 Stable | HTML generation, annotations, monitor |
| CI/CD Integration | 🔴 Planned | not yet available |
⚠️ Requires Claude Code + agent-browser plugin environment. Some flows are experimental and evolving fast.
Four AI-powered modules. Use one, two, or all four. No test files to write.
📸 Visual E2E Debugger
Auto-discover routes, generate tests, mark bugs on screenshots — AI traces to source code and fixes automatically.
/sg-visual-run
🔍 Code Audit
Parallel AI agents scan your entire codebase, find bugs, and fix them automatically. Race conditions, auth gaps, silent exceptions, resource leaks.
/sg-code-audit
🎬 Macro Recorder
Record your browser interactions and turn them into replayable tests. Like Excel's macro recorder, but for visual testing.
/sg-record http://localhost:3000
🧠 Self-Improving Engine
ShipGuard learns from every run and gets smarter. Scouts GitHub for new techniques. Each audit is better than the last.
/sg-improve
Install
claude plugin add bacoco/shipguard
npm install -g agent-browser && agent-browser install --with-deps


⚠️ Token Usage — Code audits are token-intensive.
standard(10 agents) ≈ 2M tokens.deep(15 agents, 2 rounds) ≈ 5M+.paranoid(20 agents, 3 rounds) can exceed 10M.
Visual E2E Debugger
Mark bugs directly on screenshots. The AI traces each annotation to source code and fixes it.

/sg-visual-run I changed the sidebar
Commands
| Command | What it does |
|---|---|
/sg-visual-discover | Scan codebase, generate YAML test manifests per route |
/sg-visual-run [what] | Execute manifests — natural language or flags |
/sg-visual-review | Launch interactive screenshot review dashboard |
/sg-visual-fix | Auto-fix bugs annotated in the review dashboard |
/sg-visual-review-stop | Stop the review server |
Client Validation Reports
Generate static HTML decision pages from before/after visual evidence so a client or stakeholder can validate UI changes without reading the technical dashboard.
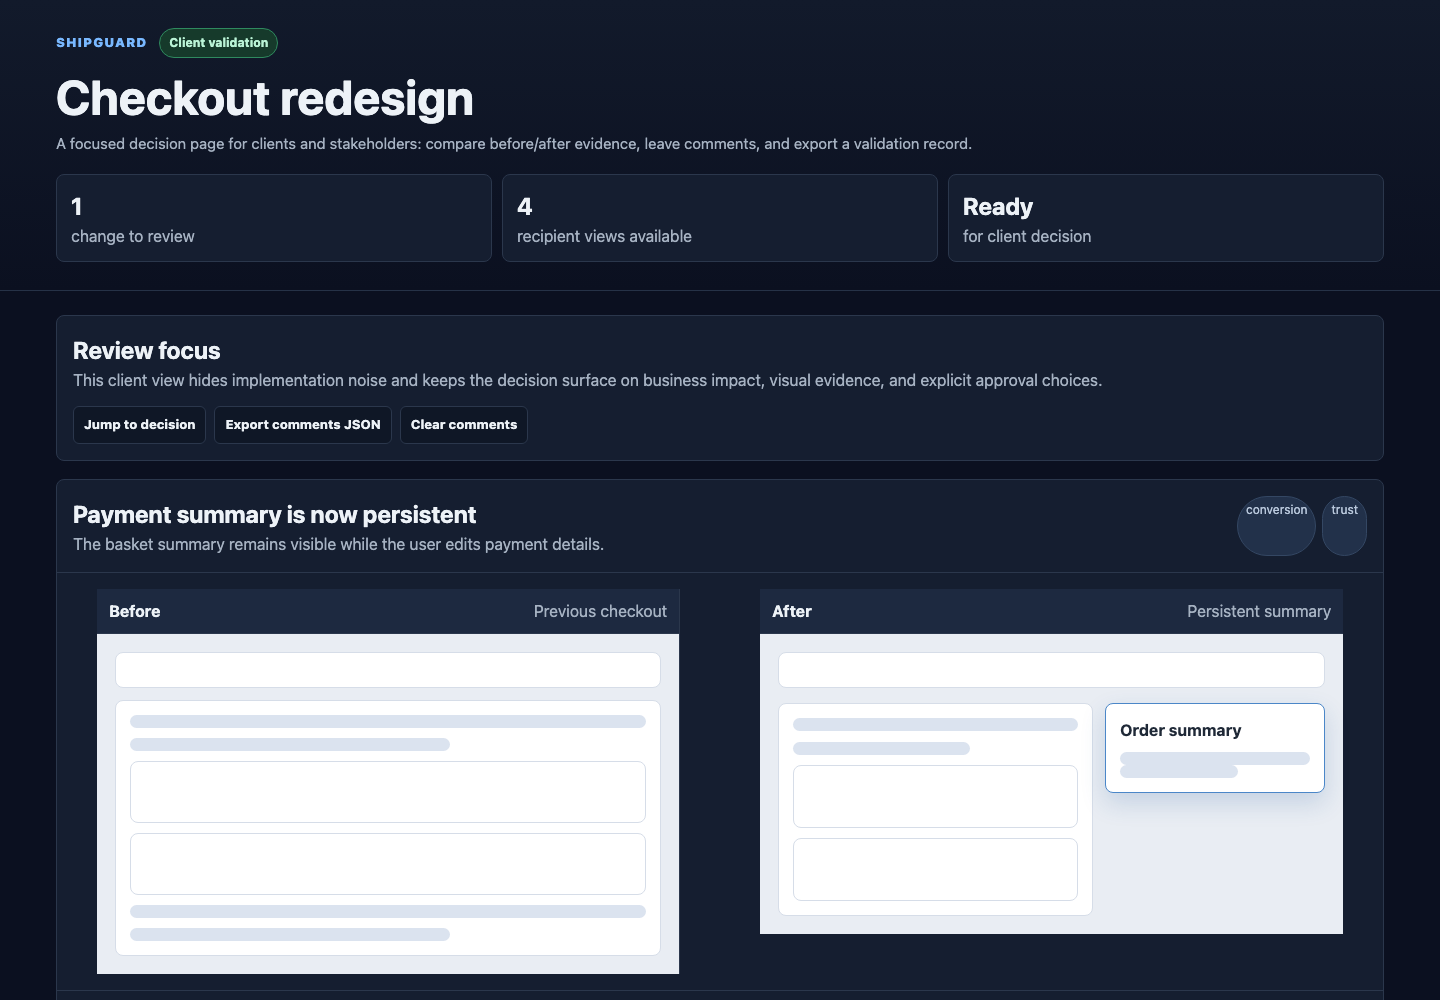
Open the standalone example: plugins/shipguard/examples/client-validation-report.html
Client, product, design, engineering, and custom recipient views can be generated from the same visual-tests/_results/change-reports/<report-id>/report.json spec. Each page includes Accept / Adjust / Reject, free-form comments, and JSON export.
For manual client validation, ShipGuard also generates client-invite-email.md, client-response-email.md, proposal-trace.md, and proposal-trace.json next to the report. This keeps a trace of what was proposed and gives the client a ready-to-send response template without requiring email-provider integration.
Smart Annotations (Gemini-style)
The review dashboard uses draggable annotation cards to mark visual bugs on screenshots. Click anywhere on a screenshot to place a pin, then describe the problem.
How it works:
- Open a screenshot in the lightbox
- Double-click anywhere on the image — a pin appears instantly (or click + Add Note first)
- Click = point pin. Drag = rectangle zone selection (highlights the problem area)
- Choose severity + type your note → a card appears connected to the pin
- Drag the pin to reposition — zone, card, and leader line all move together
- Drag the card separately to reposition just the label
- Double-click a card to edit text/severity, click X to delete
- Click Validate & Generate Report when done → produces
fix-manifest.jsonwith zone coordinates - Run
/sg-visual-fix→ AI reads your annotations + zone coords, traces to source code, fixes automatically
Severity colors:
| Color | Level | When to use |
|---|---|---|
| 🔴 Red | Critical | Broken layout, missing content, crash |
| 🟠 Orange | High | Wrong alignment, color mismatch, bad spacing |
| 🔵 Blue | Medium | Minor visual inconsistency, polish needed |
| ⚪ Gray | Info | Suggestion, not a bug |
sg-visual-run options
/sg-visual-run                                  # Interactive — choose scope
/sg-visual-run I changed the sidebar, check it  # Natural language
/sg-visual-run --from-audit                     # Test audit-impacted routes
/sg-visual-run --regressions                    # Re-run previously failed tests
/sg-visual-run --all                            # Full suite
--from-audit reads impacted_ui_routes (or legacy impacted_routes) from audit-results.json — a natural bridge between Code Audit and Visual Debugger.
Discover options
/sg-visual-discover                    # Current project
/sg-visual-discover --all              # Full discovery
/sg-visual-discover --refresh-existing # Regenerate existing manifests
Supports Next.js (App Router & Pages Router), React Router, Vue, Angular.
Macro Recorder
Record what you do in the browser and turn it into a replayable test. Like Excel's macro recorder, but for visual testing.

/sg-record http://localhost:3000/dashboard --name my-test
How it works
- Launch — Opens a Playwright browser with a floating toolbar
- Navigate — Browse your app normally. Clicks, inputs, uploads are captured automatically
- Check — Click the Check button, then click an element to mark it as an assertion
- Undo / Delete / Pause — Fix mistakes without restarting
- Stop — Saves a YAML manifest ready for
/sg-visual-run
Test Library
Recorded tests appear as cards in the review dashboard under the Recorded Tests tab.

Select the tests you want to run, click Run — the command is ready to copy.

Two ways to create tests
/sg-visual-discover | /sg-record | |
|---|---|---|
| Source | AI scans your code | Human records interactions |
| When | After code changes | After manual QA, bug reproduction, new feature walkthrough |
| Output | Same YAML format | Same YAML format |
Both feed into the same pipeline: sg-visual-run executes them, sg-visual-review shows results, sg-visual-fix fixes failures.
Options
/sg-record http://localhost:3000                              # Interactive — asks for name on stop
/sg-record http://localhost:3000 --name login-flow            # Preset name
/sg-record http://localhost:3000 --storage auth.json          # Skip login (reuse saved auth)
/sg-record http://localhost:3000 --save-storage auth.json     # Save auth for future recordings
Code Audit
Dispatch parallel AI agents to audit your entire codebase. Each agent reviews a non-overlapping zone, finds bugs, fixes them, and produces structured JSON. Watch progress in real-time on the Mission Control dashboard.
/sg-code-audit deep
Modes
| Mode | Agents | Rounds | Coverage |
|---|---|---|---|
| quick | 5 | 1 | Surface scan |
| standard | 10 | 1 | Full codebase (default) |
| deep | 15 | 2 | Surface + runtime behavior |
| paranoid | 20 | 3 | Surface + runtime + edge cases & security |
Multi-round depth
- R1 — Null refs, missing guards, type mismatches
- R2 — Race conditions, async pitfalls, state management
- R3 — Edge cases, injection, auth bypass, data leaks
Model Configuration
By default, auto mode uses Haiku for R1 (fast surface scan) and Opus 4.7 for R2/R3 (deep bug hunt — the +8 points SWE-bench Verified gap over Sonnet 4.6 translates to real cross-file bugs caught). Override with --model to control which model runs all rounds:
| Flag | Behavior |
|---|---|
--model=auto | Haiku for R1, Opus for R2/R3 (default) — depth where it matters |
--model=haiku | Haiku everywhere — fast triage, more noise |
--model=sonnet | Sonnet everywhere — balanced, use when Opus weekly quota is saturated |
--model=opus | Opus everywhere — maximum depth (R1 too), highest token cost |
/sg-code-audit deep --model=opus          # Critical audit with maximum depth (R1 too)
/sg-code-audit --model=haiku --all        # Quick full-repo sweep, minimal cost
/sg-code-audit --model=sonnet             # Run when Opus weekly cap is tight
/sg-code-audit deep --model=opus --focus=src/auth/  # Max rigor on auth code
Why R2/R3 uses Opus by default: Surface pattern scans (R1) are bulk work — Haiku handles them fine. Deep/paranoid rounds hunt subtle cross-file and logic bugs, where Opus 4.7's reasoning advantage turns into real findings. Anthropic's benchmarks show Opus 4.7 at 87.6% SWE-bench Verified vs 79.6% for Sonnet 4.6.
Smart Scope
By default, ShipGuard detects what changed and asks whether to limit the audit:
/sg-code-audit # "12 files changed since main. Audit only what changed?"
Override with flags:
| Flag | Effect |
|---|---|
--all | Force full scope, skip the question |
--diff=<ref> | Use a specific base reference |
--focus=path/ | Restrict to a directory |
--report-only | Find bugs but do not fix them |
--model=<model> | Override model strategy (see above) |
Flags combine freely: /sg-code-audit deep --focus=src/ --report-only --model=opus
Live Dashboard
At startup, the audit offers to open the Mission Control dashboard. The Code Audit tab shows real-time agent pods (running/done/pending), severity heatmap, bug table filterable by severity and free-text search. Polls every 3s during active audit.
Finding Verification
After zone agents return findings, ShipGuard independently verifies each critical/high bug is real — not a hallucination.
Two-stage filter:
- Constitutional pre-filter (zero LLM cost) — checks the cited file exists, line number is in range, bug ID format is valid. Catches obvious hallucinations instantly.
- Haiku verification agents — one agent per finding, all dispatched in parallel. Each reads the actual file:line and scores 0-100.
| Score | Verdict | Action |
|---|---|---|
| 80-100 | Confirmed | Kept as-is |
| 40-79 | Uncertain | Severity downgraded (critical→high, high→medium) |
| 0-39 | Rejected | Moved to unverified_bugs (kept for audit trail) |
Cuts false positives ~15-30%. Medium/low findings skip verification (too cheap to be worth it).
Risk Score
A single 0-100 number representing codebase risk. Uses geometric weighting — many low-severity findings can't inflate past the worst single finding:
1st finding:  100% of base points (critical=25, high=15, medium=5, low=1)
2nd finding:   50%
3rd finding:   25%
4th finding:   12.5%  ...and so on
| Score | Risk level |
|---|---|
| 0-15 | Low — mostly clean |
| 16-35 | Moderate — some real issues |
| 36-60 | High — significant bugs |
| 61-100 | Critical — severe issues |
Output
Results are written to two formats:
audit-results.json (canonical):
summary— totals by severity, category, andrisk_score(0-100)verification— how many findings were checked, confirmed, uncertain, rejectedbugs[]— file, line, severity, description, fix status,verification_score,verifiedunverified_bugs[]— findings rejected by verification (score < 40)impacted_ui_routes[]— UI routes affected (consumed by/sg-visual-run --from-audit)impacted_backend[]— API endpoints/services affected (reported in dashboard)
audit-results.toon (compact, ~40% fewer tokens):
# bugs[107]{id,severity,category,file,line,title,verified,score}:
r1-z01-001,high,logic-error,src/components/foo.tsx,71,key={index} on list,true,95
r1-z01-002,medium,error-handling,routes/chat.py,142,bare except,uncertain,55
Header-once + CSV-rows encoding. Used by sg-improve for cheaper LLM analysis.
Supported languages
Python, TypeScript/React, Next.js, Infrastructure (Docker/YAML/CI), Go, Rust, JVM.
Self-Improving Engine
The other three modules find bugs, test UI, and record flows. This module makes them get better over time.
No ML model. No fine-tuning. Just structured memory and adaptive prompts — each run accumulates knowledge that the next run uses automatically.
/sg-improve — Learn from sessions
After each audit or test session, extract what worked and what didn't.
/sg-improve              # Full loop — local learnings + GitHub issue
/sg-improve --local-only # Save learnings locally, skip GitHub
/sg-improve --dry-run    # Preview what would be saved
/sg-improve --rollback   # Undo the last sg-improve (safety net)
/sg-improve --history    # List all snapshots
What gets learned:
| Learning | Example | Used by |
|---|---|---|
| Zone sizing | "hooks/ needs max 80 files per zone" | Code Audit zone discovery |
| Bug patterns | ".first() without None guard → critical" | Agent checklist injection |
| Noise filters | "f-string loggers → batch into single entry" | Agent prompt |
| Infra timing | "api-synthesia needs 4 min to start" | Post-audit rebuild |
| Success patterns | "worktree isolation works — don't change" | What NOT to touch |
| Coding mistakes | mistakes.md — error journal read at every session | All development |
User friction detection: sg-improve also scans user messages for correction/frustration signals:
| Signal | Pattern | Priority |
|---|---|---|
| Command failure | Tool exit code != 0 | 100 |
| User correction | "I said", "that's wrong", "pas ca" | 80 |
| Redo request | "refais", "try again", "relance" | 70 |
| Repetition | Same instruction 2+ times (Jaccard > 0.5) | 60 |
| Tone escalation | 3+ uppercase words, 2+ exclamation marks | 40 |
These signals feed into learnings alongside the structured audit data.
The reinforcement loop:
Run 1: hooks/ overflows at 172 files → sg-improve saves max_files: 80
Run 2: sg-code-audit reads the hint → splits into 2 zones → no overflow ✓

Run 1: .first() crashes found 5 times → sg-improve saves audit_hint
Run 2: agents see the pattern in their checklist → catch it on first scan ✓
Built-in safety: Every /sg-improve run takes a snapshot before modifying anything. If the changes make things worse, /sg-improve --rollback restores the previous state instantly.
/sg-scout — Learn from the ecosystem
Scan GitHub for techniques that could make ShipGuard better.
/sg-scout                                # Full scan — find relevant repos
/sg-scout https://github.com/owner/repo  # Deep-dive on one repo
/sg-scout --topic=self-improving         # Focus on auto-optimization
Each technique is scored on impact, novelty, applicability, and effort. High-scoring ideas become GitHub issues on bacoco/ShipGuard. All findings accumulate in docs/scout-reports/techniques-library.md.
Two feedback paths:
| Path | What flows | Who benefits |
|---|---|---|
Local (.shipguard/) | Zone hints, patterns, noise filters, mistakes | Your project |
| Upstream (GitHub issues) | Generic improvements, techniques | Everyone using ShipGuard |
Inspired by eval-robuste and self-improving-agent-skills.
Compatibility
Built for Claude Code. Partial support for other AI CLIs:
| Feature | Claude Code | Codex CLI / Gemini CLI |
|---|---|---|
| Code Audit (parallel) | ✅ Full | ❌ Requires Agent tool |
| Visual E2E Debugger | ✅ Full | ✅ agent-browser is CLI-independent |
| Macro Recorder | ✅ Full | ✅ Playwright is CLI-independent |
| Review Dashboard | ✅ Full | ✅ Pure Node.js |
| Visual Discover/Fix | ✅ Full | ✅ Bash + LLM prompts |
| Self-Improving Engine | ✅ Full | ✅ gh CLI is universal |
The visual testing pipeline works with any AI CLI that can run shell commands and read/write files. Code audit parallelization requires Claude Code's Agent tool with worktree isolation.
Community adapters welcome.
Quick Start
# Install
claude plugin add bacoco/shipguard
npm install -g agent-browser && agent-browser install --with-deps

# Audit your code
/sg-code-audit

# Record a test manually
/sg-record http://localhost:3000

# Run all tests
/sg-visual-run

# Learn from the session
/sg-improve
Configuration
Create visual-tests/_config.yaml:
base_url: "http://localhost:3000"
credentials:
  username: "testuser"
  password: "testpass"
build_command: "docker compose up -d --build frontend"  # optional
License
MIT