
Tufte Claude Skill
aref-vc/tufte-claude-skill
Gráficos honestos e minimalistas baseados nos princípios de Edward Tufte
Ver no GitHubSkill que transforma requisições simples como 'faça um gráfico' em visualizações Tufte-compliant, aplicando os dez princípios de design de dados extraídos das três obras fundamentais de Edward Tufte. Maximiza razão dados-tinta, elimina chartjunk e garante integridade gráfica em cada visualização.
Instalação
npx convez-ai aref-vc/tufte-claude-skill1 comando no terminal: detecta o formato do repositório (marketplace ou plugin avulso) e instala via Claude Code. Requer Node 18+ e o Claude Code instalado.
Métricas
Casos de uso
- Gerar gráficos de dados com máxima clareza e mínima redundância visual
- Criar visualizações que respeitam integridade estatística e evitam manipulação visual
- Produzir small multiples e comparações lado-a-lado para dados multidimensionais
Veredito

Skill sólida que implementa rigorosamente as regras clássicas de visualização de dados de Tufte. Ideal para quem quer gráficos diretos, sem ruído visual, mas exige compreensão dos princípios para sacar todo o potencial.
README
A tradução para o português deste README ainda está na fila.
tufte-claude-skill
A Claude Code skill that turns "make me a chart" into a Tufte-compliant chart. Distilled from the three foundational books by Edward R. Tufte.
Install
Clone into your Claude Code skills directory:
git clone https://github.com/aref-vc/tufte-claude-skill.git ~/.claude/skills/tufte
That's it. Claude Code auto-loads the skill on next launch. To verify, run /tufte or ask Claude to "make a chart of anything."
To update later:
cd ~/.claude/skills/tufte && git pull
To uninstall:
rm -rf ~/.claude/skills/tufte
The three books, distilled
Tufte gives the three-book taxonomy himself on page 9 of Visual Explanations:
- VDQI — how to depict data and enforce statistical honesty. The book that gave us data-ink ratio, chartjunk, lie factor, small multiples.
- EI — how to lay out information in space. Layering, micro/macro readings, color rules, escaping flatland.
- VE — how to show motion, causality, narrative. The smallest effective difference, parallelism, visual confections.
Together they yield the ten principles this skill applies.
The ten principles
- Show the data. Above all else. Every other decision asks "does this help the reader see the data?"
- Maximize the data-ink ratio. Ink that would change if the data changed is data-ink. Everything else is overhead.
- Erase non-data-ink. Drop the frame box, drop the gridlines, drop the ticks at minor units.
- Erase redundant data-ink. Pick one encoding per quantity. A bar plus a number plus a gridline plus an axis tick all saying "37" is one thing said four times.
- Graphical integrity. Lie factor between 0.95 and 1.05. Bar charts start at zero. Never use area for a 1D quantity.
- Small multiples. When you have a cross-cut (region, segment, cohort), make N small charts on a shared scale instead of one chart with N lines.
- Layering and separation. Data on top, labels next, scaffolding faintest. Watch for the 1+1=3 effect — when two heavy elements interact to create unintended visual noise.
- Micro/macro readings. Good charts work at two scales: one shape from across the room, every data point legible up close.
- The smallest effective difference. "Make all visual distinctions as subtle as possible, but still clear and effective." Gray for context, one accent for focus.
- Word-data integration. Sparklines belong in sentences. Numbers belong next to their visual. Tables are charts too.
Tufte's own five-line summary from VDQI p.105:
Above all else show the data. Maximize the data-ink ratio. Erase non-data-ink. Erase redundant data-ink. Revise and edit.
How the skill works
When you ask Claude to make, design, critique, or improve any chart, the skill activates automatically. It then:
- Reads
principles.mdto recall the ten rules. - Picks the chart type from
chart-selection.mdbased on your data shape and goal — not from what's familiar or what the library makes easy. - Applies
kill-list.md— removes the things that don't belong (3D, pie, dual-axis, rainbow scales, frame boxes, redundant legends). - Produces the chart in your preferred stack: self-contained HTML/SVG, or React (Recharts + D3).
- Runs
checklist.mdas a final pass before declaring it done.
Default strictness: Tufte by default, override per chart on request ("I need a pie because the CFO wants one" → comply, but note the alternative).
The one-page cheatsheet
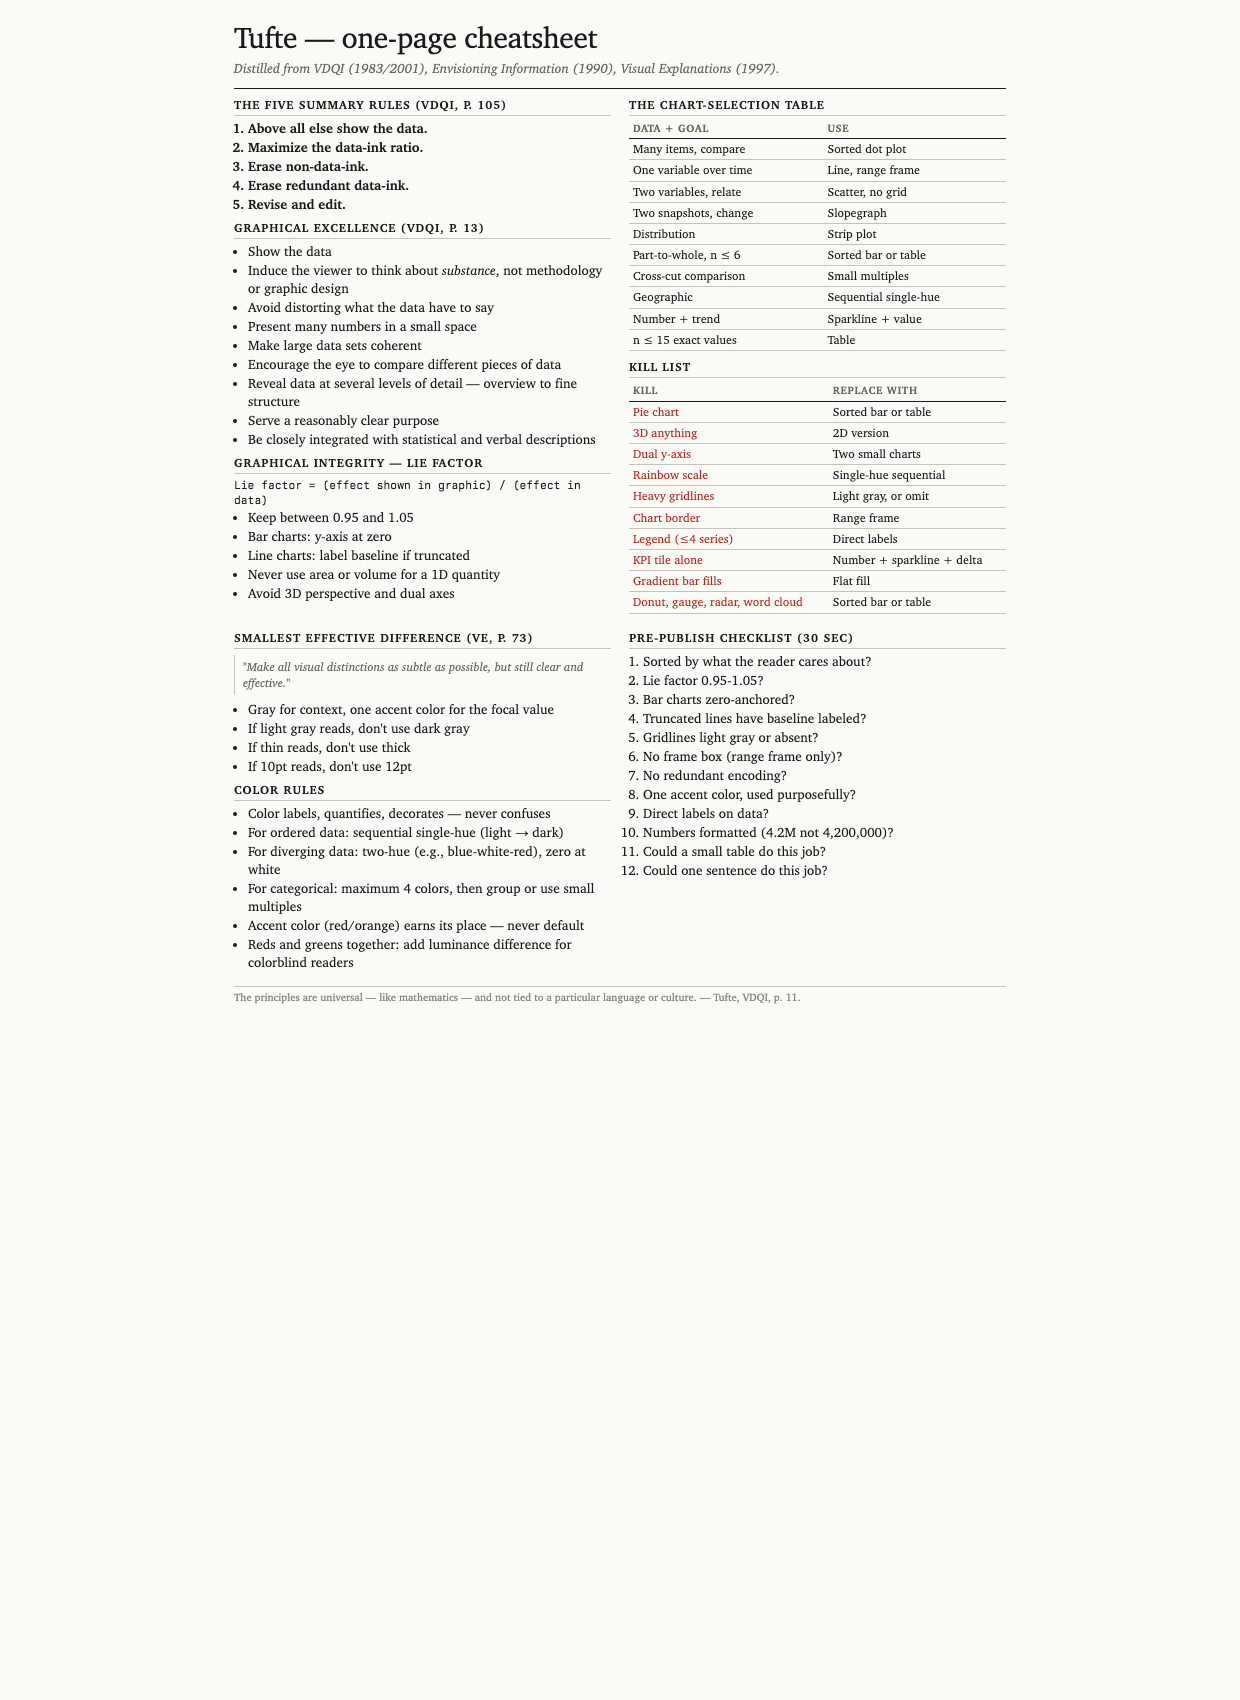
A printable reference covering principles, lie-factor formula, chart-selection table, kill list, color rules, and the 12-item checklist. Open cheatsheet.html in a browser or print cheatsheet.pdf.
Before and after
Nine pairs comparing typical AI/BI default output (left) to Tufte-applied output (right). The full interactive gallery is at before-after.html — open in any browser. Six pairs inlined here:
1. Category comparison — sales by product
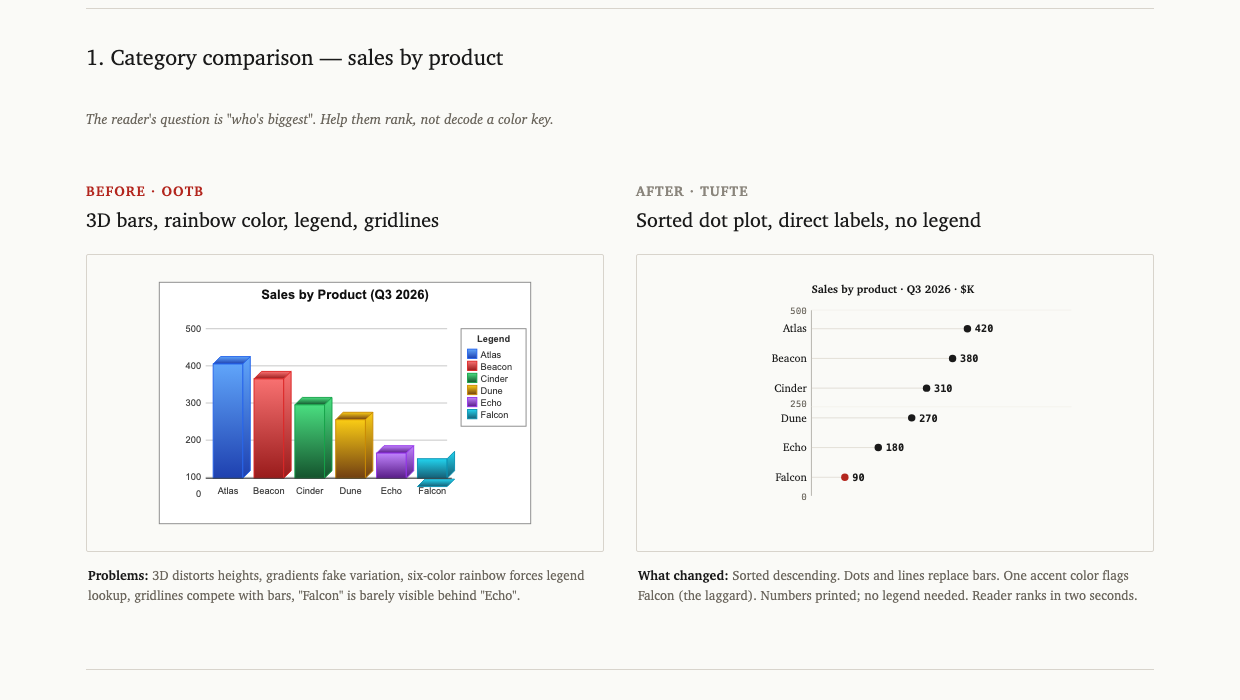
3D bars with a six-color rainbow legend become a sorted dot plot with direct labels. The reader ranks in two seconds instead of decoding a key.
2. Time series — monthly active users
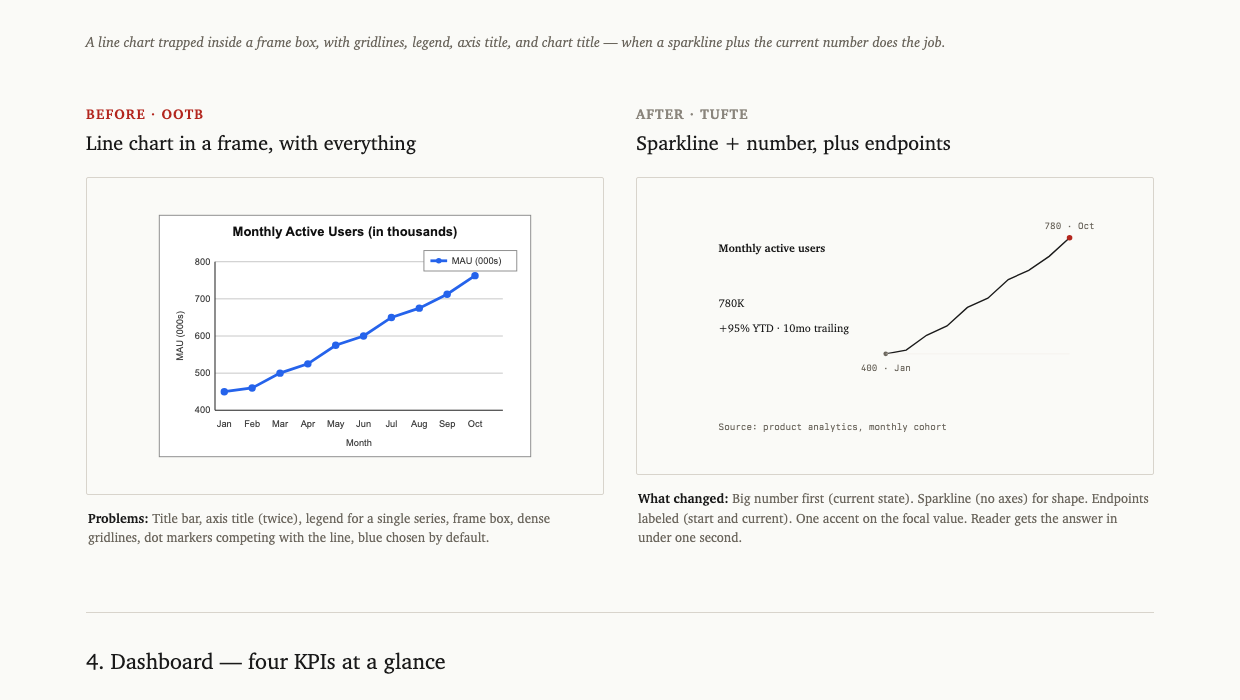
A line chart trapped in a frame box (with gridlines, legend, axis title, chart title) becomes a sparkline plus the current value plus two endpoint labels. Same data, ~80% less ink.
3. Dashboard — four KPIs
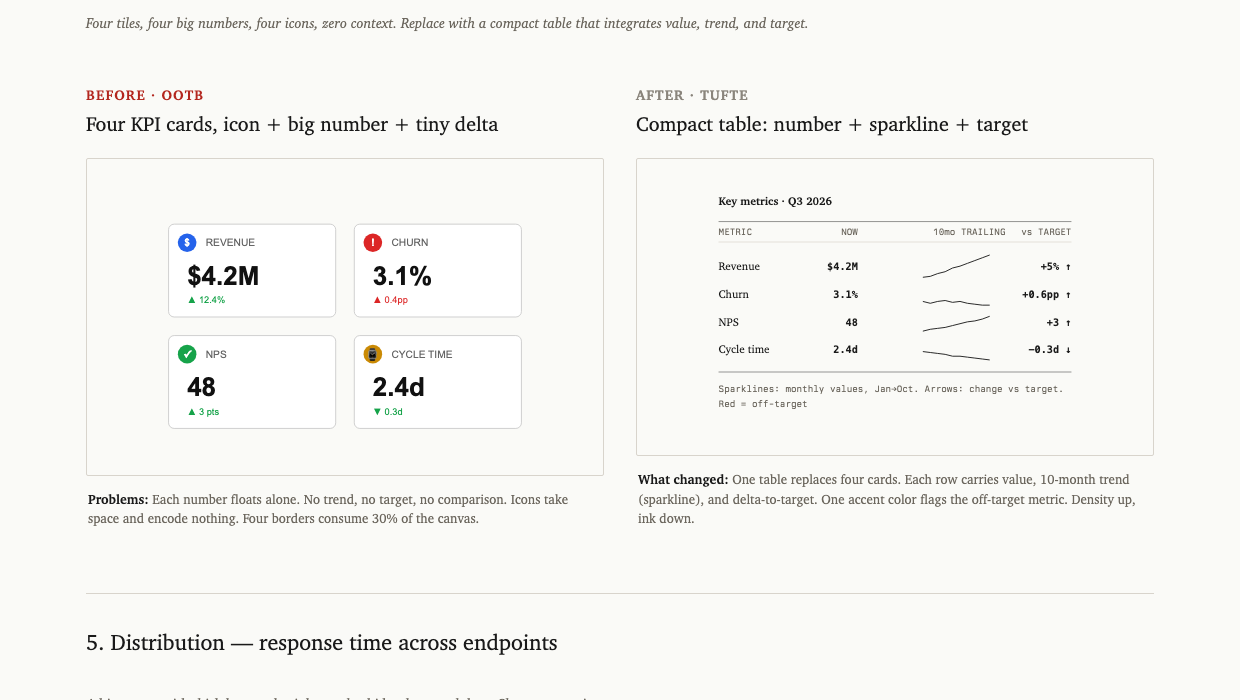
Four KPI tiles with giant numbers and decorative icons become a compact table with value, sparkline (10-month trend), and delta-to-target. One accent color flags the metric that's off-target.
4. Period comparison — Q2 vs Q3 by team
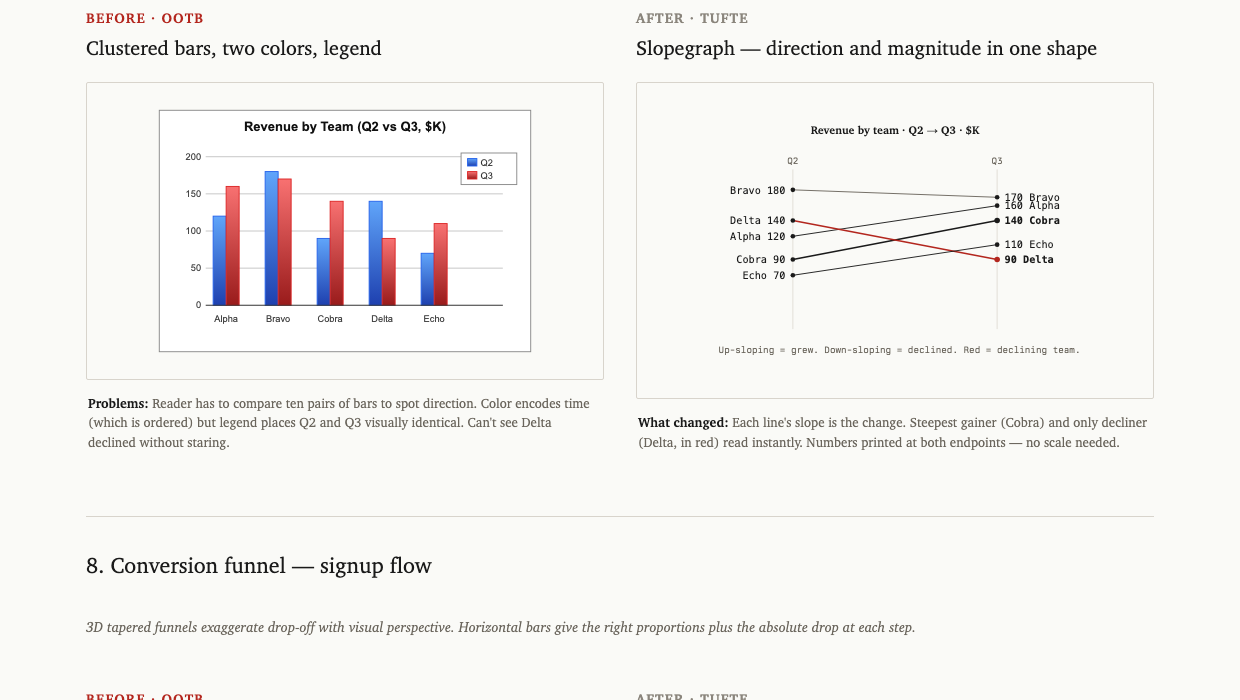
Clustered bars (two colors, ten bars to mentally pair up) become a slopegraph. Each line's slope is the change. Steepest gainer and only decliner read instantly without decoding a legend.
5. Conversion funnel — signup flow
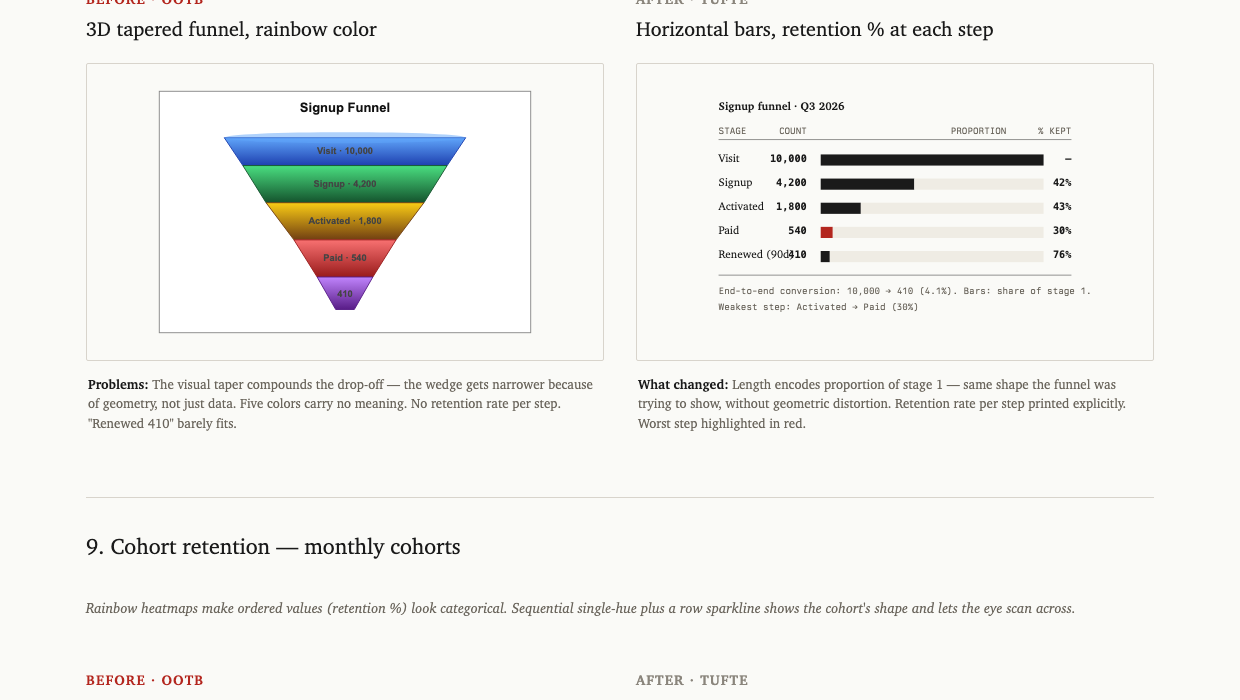
A 3D tapered funnel chart (where the visual taper exaggerates the drop-off) becomes horizontal bars sized by share of stage 1, with retention percentage printed per step. The worst step is annotated.
6. Cohort retention
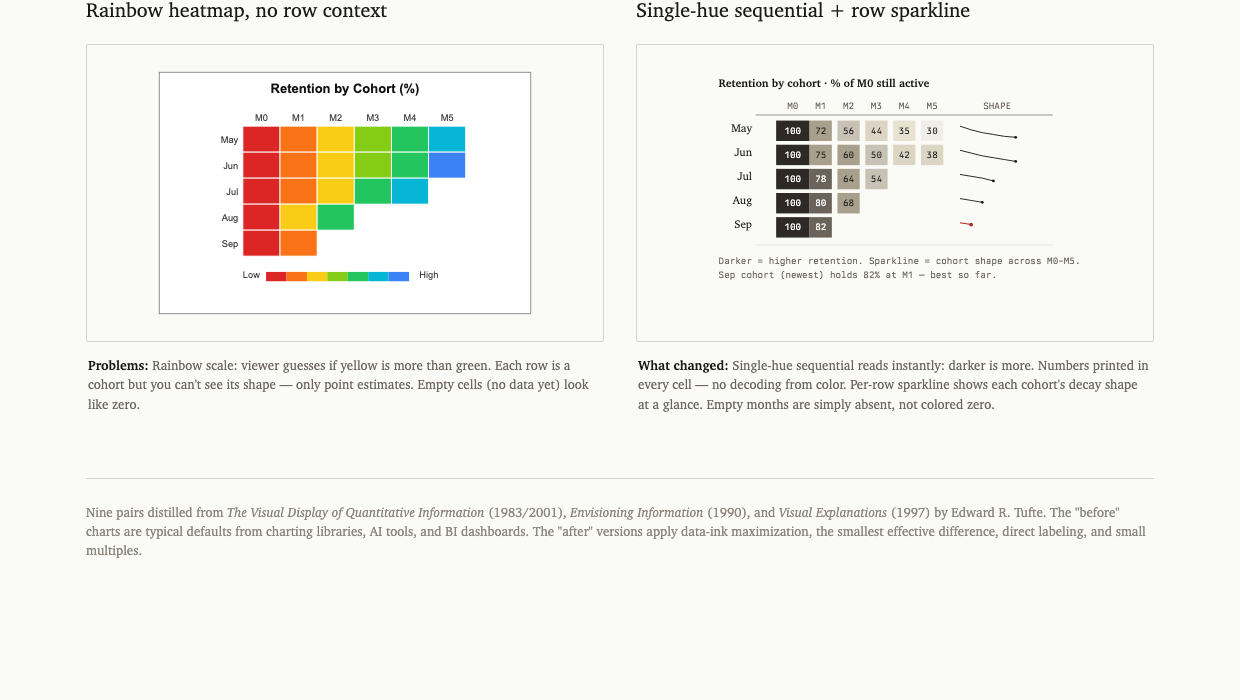
A rainbow heatmap (where viewers guess if yellow is more than green) becomes a sequential single-hue table with numbers printed in every cell and a sparkline showing each cohort's decay shape.
The other three pairs in the gallery: part-to-whole (pie → sorted table), distribution (rainbow histogram → strip plot with quantile markers), geographic (rainbow choropleth → sequential single-hue with annotations).
When to use the skill
The skill auto-activates on any of these:
- "Make a chart of...", "visualize...", "graph...", "plot..."
- "Build a dashboard for...", "design a KPI tile..."
- "Improve this chart", "critique this visual"
- "What chart should I use for...?"
- Direct invocation:
/tufteor mentioning Tufte by name - Any project where chart code is being added or edited
It does not activate for:
- Logo design, illustration, or decorative graphics
- Flowcharts, architecture diagrams, hand-drawn sketches
- Pure typography or layout that has no quantitative data
How to use the skill
Fast path
Just ask. The skill loads automatically and produces a Tufte-compliant chart:
Make a chart of monthly revenue for the last 12 months
You'll get a sparkline with the current value, two endpoint labels, no frame box, no legend.
Stack choice
Tell Claude which output you want:
| Say | You'll get |
|---|---|
| "as inline SVG" or no preference | Self-contained HTML/SVG, single file |
| "in React" or "with Recharts" | Recharts component with Tufte theme |
| "with D3" | D3-in-React (for dot plots, slopegraphs, custom small multiples) |
Override the defaults
If you specifically need something on the kill list:
Make a pie chart of revenue mix — the CFO wants a pie
Claude will produce the pie, but include a one-line comment noting the Tufte alternative (a sorted table). You stay in control.
Iterate on an existing chart
Paste your chart code or screenshot and say:
Apply Tufte to this
Claude will identify violations (frame box, gridlines, gradient fills, redundant legend, wrong sort), and produce a rewritten version.
File index
| File | Purpose |
|---|---|
SKILL.md | Trigger description + skill index (loaded by Claude) |
principles.md | The ten rules, with Tufte's exact quotes |
chart-selection.md | Data + goal → chart type decision table |
kill-list.md | What to remove from any chart |
before-after.html | Nine side-by-side comparisons (open in browser) |
checklist.md | 12-item pre-publish check |
cheatsheet.html / cheatsheet.pdf | One-page printable reference |
presets/html-svg.md | Style tokens + working SVG templates (sparkline, dot plot, line, small multiples, sparkline-in-table) |
presets/react.md | Recharts theme + D3-in-React patterns (slopegraph, dot plot, what-to-never-import list) |
Requirements
- Claude Code installed
- Skill auto-loads from
~/.claude/skills/ - No other dependencies for the skill itself
- The cheatsheet PDF is included, but to regenerate it from the HTML you'll need
weasyprint(pip install weasyprint)
Contributing
Pull requests welcome. Useful additions:
- More before/after pairs (sankey, network, gantt, calendar heatmap, control chart)
- Output presets for other stacks: Python (matplotlib, plotly), Observable Plot, Vega-Lite, ggplot2
- Examples that show Tufte applied to real-world charts you've improved
Open an issue first for anything that adds a new chart type to the decision table — let's discuss the rule before adding it.
License
MIT. Use it, modify it, ship it.
The skill content is original; quotations from Tufte's books are used under fair-use for educational reference and are attributed inline.
The principles of information design are universal — like mathematics — and are not tied to unique features of a particular language or culture.
— Edward R. Tufte, Envisioning Information, p. 10