
Detecção de Ilhas de Calor Urbano com PyQGIS + Claude AI
1988Cameroun/urban-heat-qgis
Detecta ilhas de calor urbano em satélite + gera insights de planejamento via IA
Ver no GitHubPlugin QGIS que integra dados reais de satélite Landsat 9 com IA Claude para detectar e quantificar ilhas de calor urbano. Processa bandas espectrais (NDVI, LST) e gera relatórios estruturados de planejamento urbano automaticamente, com visualização em heatmap interativo.
Instalação
npx convez-ai 1988Cameroun/urban-heat-qgis1 comando no terminal: detecta o formato do repositório (marketplace ou plugin avulso) e instala via Claude Code. Requer Node 18+ e o Claude Code instalado.
Métricas
Casos de uso
- Análise térmica urbana com dados geoespaciais reais
- Relatórios automatizados de planejamento ambiental via IA
- Visualização 3D de sobreposição térmica em QGIS
Veredito

Projeto bem-estruturado que combina SIG profissional (PyQGIS), processamento espectral real (Landsat 9) e IA generativa para geração de relatórios. Excelente para especialistas em geoanálise e planejamento urbano que querem automatizar pipelines complexos.
README
A tradução para o português deste README ainda está na fila.
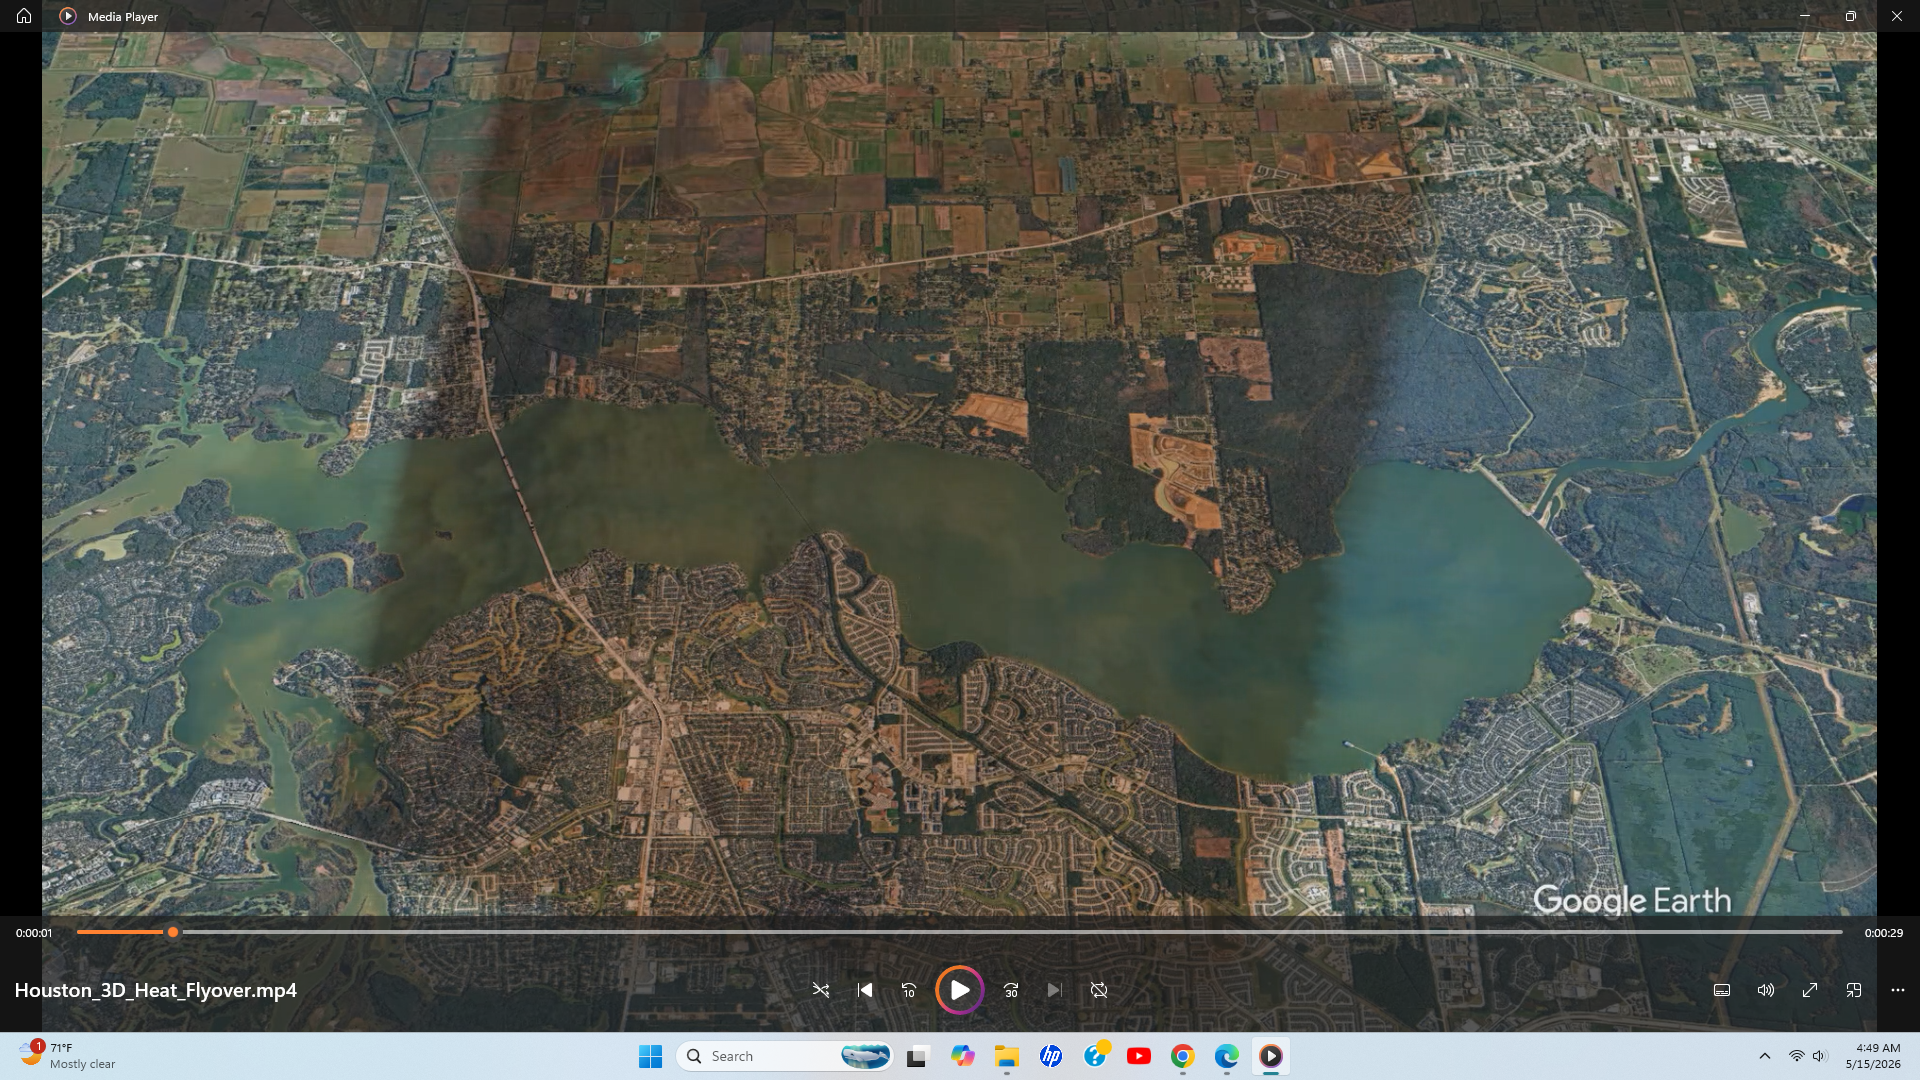
3D GIS Flyover Visualization
This project also includes a cinematic 3D terrain flyover demonstrating thermal overlay integration and geospatial animation workflows.
▶ YouTube Demo:
https://youtu.be/ku7GaLSLmMM
🌡️ Urban Heat Island Detection — PyQGIS + Claude AI
Live Demo
Interactive decision-support dashboard:
- Explore heat zones across Houston
- Adjust extreme heat thresholds in real-time
- Visualize NDVI vs temperature relationships

**Detects and quantifies urban heat islands using satellite data, generating actionable urban planning insights via an automated geospatial + AI pipeline.**
Stack: Python · PyQGIS · Anthropic API
Before and After
Raw Landsat Inputs
| Band 4 (Red) | Band 5 (NIR) | Band 10 (Thermal) |
|---|---|---|
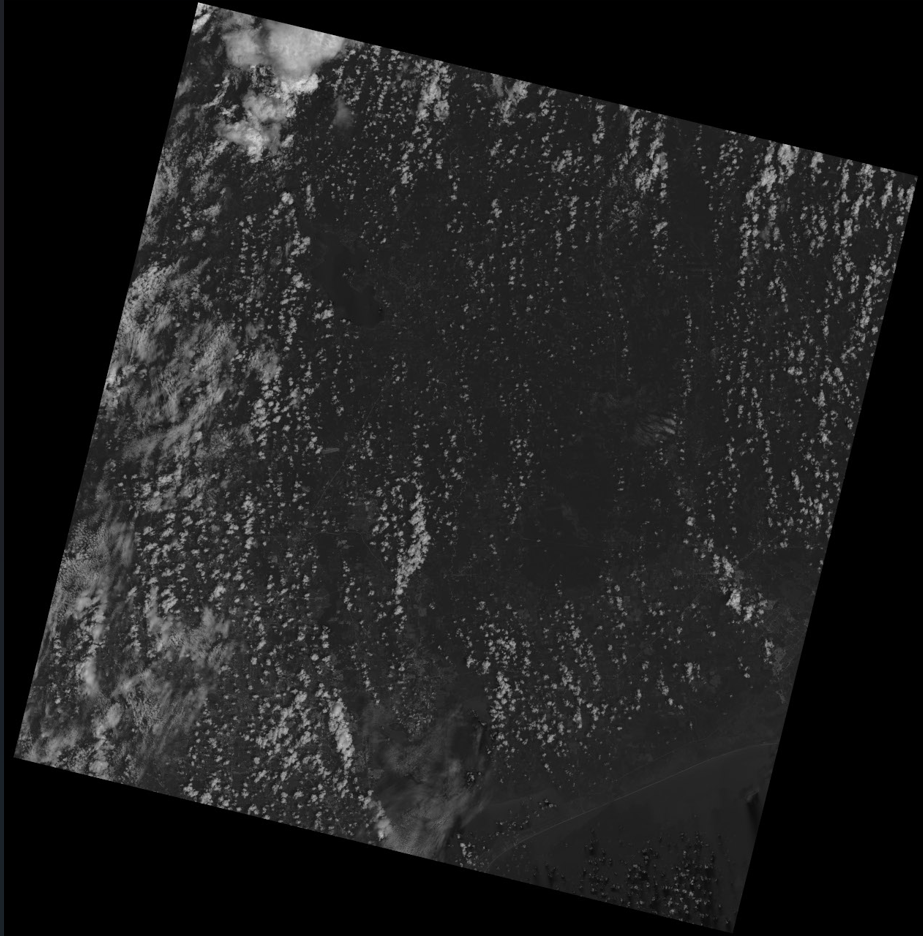 | 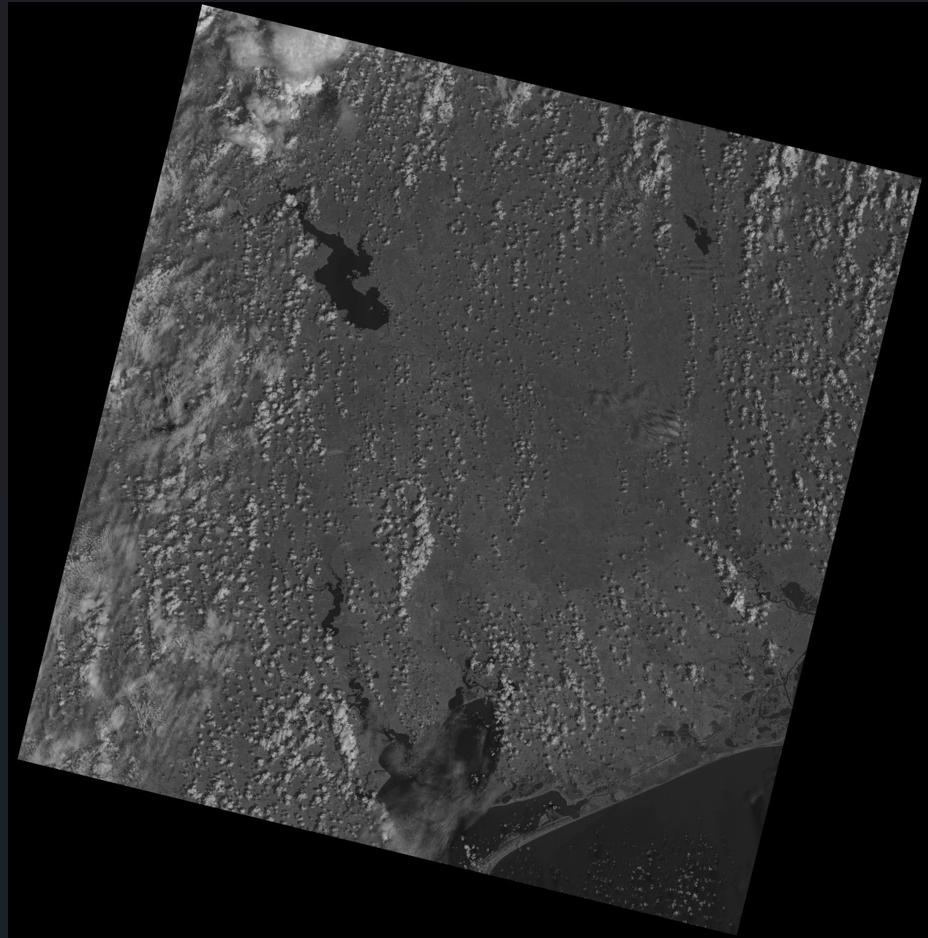 | 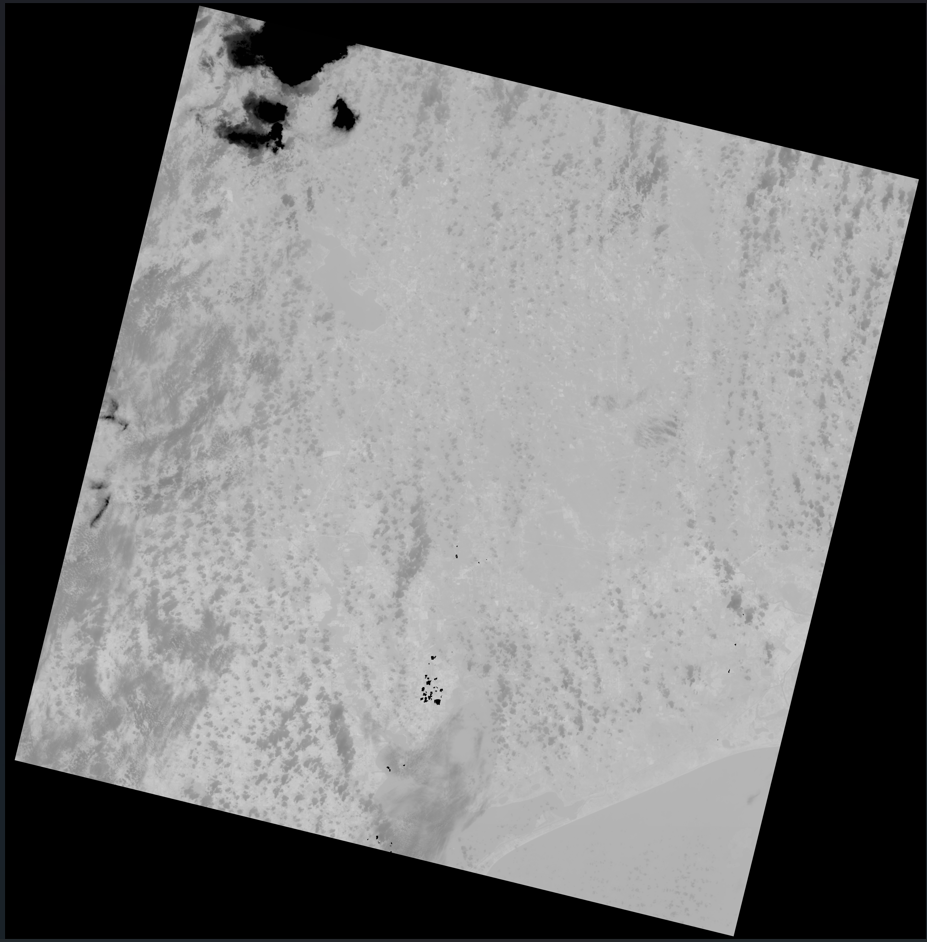 |
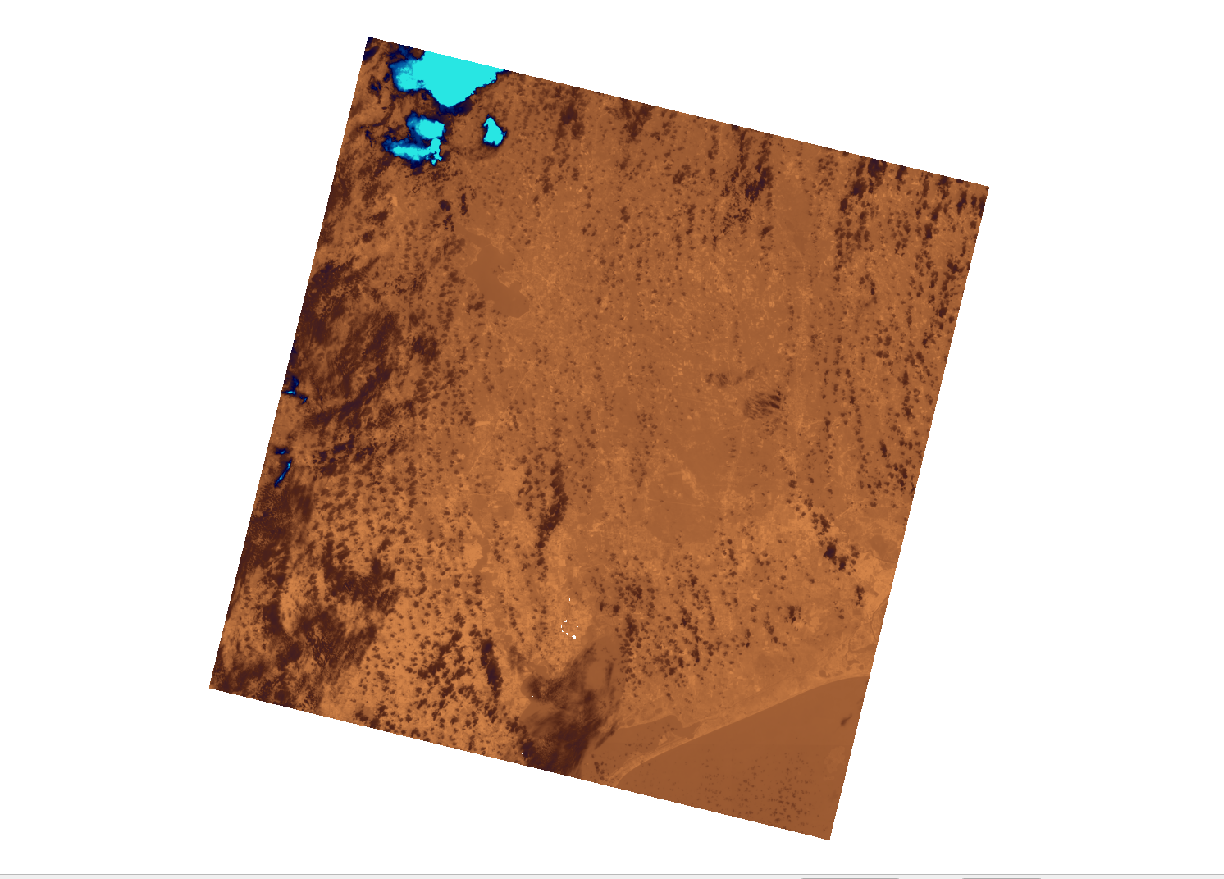
---
What This Does
Landsat 9 Bands (B4, B5, B10)
        │
        ▼
  PyQGIS Pipeline
  ├── NDVI computation     (vegetation health index)
  ├── LST computation      (land surface temp in °C)
  ├── Heat zone classification (4 tiers)
  └── Heatmap visualization (blue→yellow→red ramp)
        │
        ▼
  Claude AI (claude-sonnet)
  └── Generates structured urban planning report in Markdown
        │
        ▼
  Output: styled QGIS map + UHI\_Report\_Houston\_TX.md
---
Quick Start
1. Clone
git clone https://github.com/1988Cameroun/urban-heat-qgis.git
cd urban-heat-qgis
2. Install dependencies
pip install anthropic numpy
# PyQGIS comes bundled with QGIS Desktop — install from qgis.org
3. Set your API key
export ANTHROPIC\_API\_KEY=sk-ant-...
4a. Run Demo (no Landsat data needed)
python scripts/demo\_no\_qgis.py
This generates a full AI report using realistic Houston baseline statistics.
4b. Run Full Pipeline (with real Landsat data)
Download Landsat data:
- Go to earthexplorer.usgs.gov
- Draw AOI over Houston
- Select Landsat 9 OLI/TIRS C2 L2
- Download Bands 4, 5, and 10
Place files:
data/
├── LC09\_B4.TIF   ← Red band
├── LC09\_B5.TIF   ← NIR band
└── LC09\_B10.TIF  ← Thermal band
Run inside QGIS Python Console:
exec(open('scripts/heat\_analysis.py').read())
run\_pipeline()
Or standalone:
export QGIS\_PREFIX\_PATH=/usr   # Linux; adjust for your OS
python scripts/heat\_analysis.py
---
Output Example
# Urban Heat Island Analysis Report
\*\*City:\*\* Houston, TX

## Executive Summary
Houston's summer thermal profile reveals a pronounced urban heat island
effect, with land surface temperatures ranging from 28.4°C to 58.7°C
and a city-wide mean of 41.2°C...

## Heat Zone Analysis
| Zone          | Threshold | \~Area Coverage |
|---------------|-----------|----------------|
| Extreme Heat  | ≥ 49.9°C  | 6.7%           |
| High Heat     | ≥ 44.1°C  | 30.9%          |
| Moderate      | ≥ 41.2°C  | 50.0%          |
| Cool/Vegetated| < 38.3°C  | 30.9%          |

## Mitigation Recommendations
1. Expand tree canopy in Loop 610 industrial corridor...
2. Mandate cool roofs for new commercial construction...
...
---
Project Structure
urban-heat-qgis/
├── scripts/
│   ├── heat\_analysis.py     # Full PyQGIS pipeline
│   └── demo\_no\_qgis.py      # Demo (no QGIS needed)
├── data/                    # Place Landsat TIF bands here
├── outputs/                 # Generated TIFs + MD reports
├── reports/                 # Sample AI-generated reports
├── requirements.txt
└── README.md
---
Why This Stands Out
Most QGIS projects stop at the map. This pipeline goes further:
- PyQGIS scripting — fully automated, reproducible, no GUI clicks
- AI interpretation layer — Claude converts raw raster stats into actionable planning language
- Real-world data — uses actual Landsat Collection 2 radiometric scaling
- Reusable — swap city name + data path to analyze any metro area
---
Tech Stack
| Layer | Technology |
|---|---|
| Spatial analysis | PyQGIS 3.x, QGIS Raster Calculator |
| Data source | USGS Landsat 9 OLI/TIRS C2 L2 |
| Indices | NDVI, LST (Kelvin→Celsius) |
| AI report | Anthropic Claude (claude-sonnet) |
| Language | Python 3.10+ |
---
License
MIT